Marcus Lu
2024-06-03 15:12:25
www.visualcapitalist.com
![]() See this visualization first on the Voronoi app.
See this visualization first on the Voronoi app.
Charted: Declining Birth Rates in 6 Major Countries
This was originally posted on our Voronoi app. Download the app for free on iOS or Android and discover incredible data-driven charts from a variety of trusted sources.
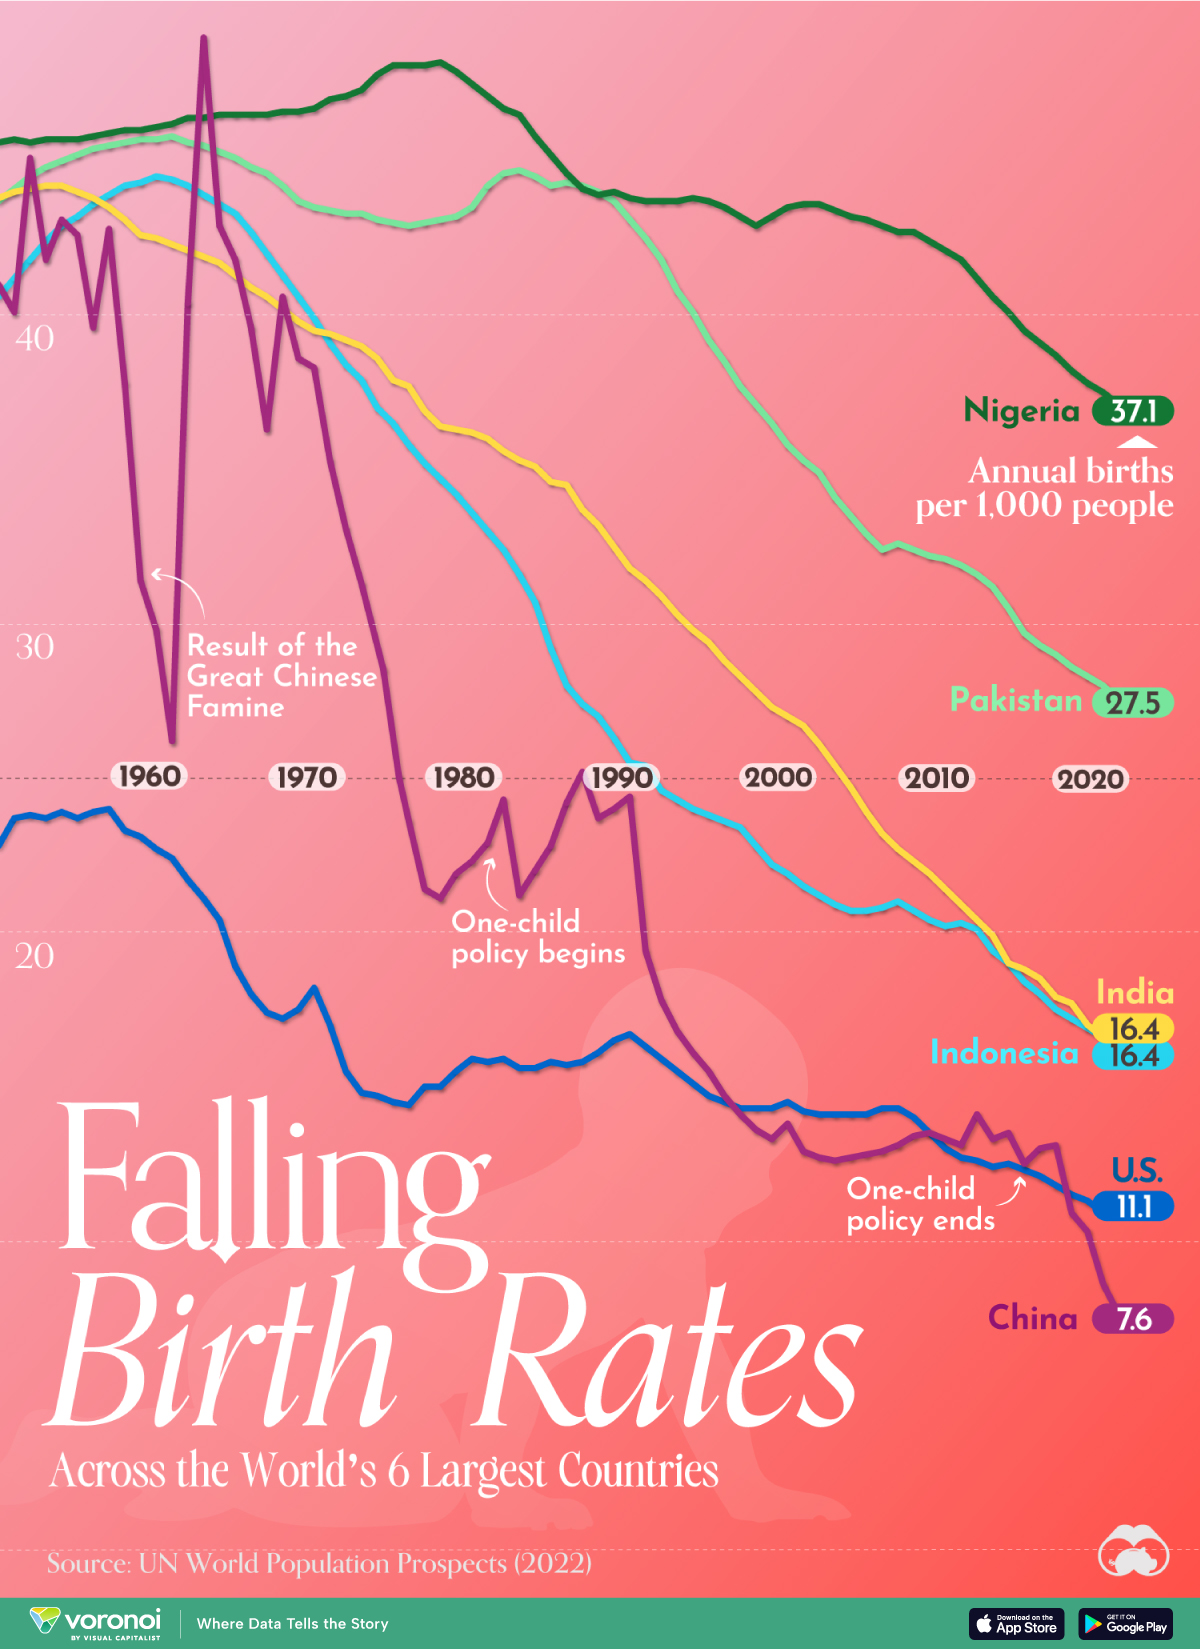
Birth rates are falling in the six most populated countries in the world, though at different speeds.
This graphic shows the annual births per 1,000 people in the world’s six largest countries by population. The data is from the UN World Population Prospects (2022) and has been compiled by Our World in Data.
The Global Decline in Fertility Rates
Fertility rates are declining in most places. According to the UN, in 1990, the average number of births per woman globally was 3.2. By 2019, this had fallen to 2.5 births per woman; by 2050, it is expected to decline further to 2.2 births.
Notably, a fertility level of 2.1 births per woman is necessary to avoid a national population decline over the long run (not including net immigration).
China’s birth rate has fallen the fastest in recent years among the countries highlighted here. The country registered 7.6 annual births per 1,000 people in 2021, compared to 24.4 in 1990 and 41.0 in 1950.
| Year | China | India | Indonesia | Nigeria | Pakistan | U.S. |
|---|---|---|---|---|---|---|
| 1950 | 41.0 | 43.8 | 40.6 | 45.6 | 43.7 | 22.8 |
| 1960 | 29.8 | 42.5 | 44.5 | 46.1 | 45.7 | 22.7 |
| 1970 | 38.3 | 39.5 | 39.9 | 46.7 | 43.5 | 18.2 |
| 1980 | 22.3 | 36.2 | 33.6 | 47.5 | 43.5 | 15.9 |
| 1990 | 24.4 | 31.8 | 25.5 | 43.8 | 43.1 | 16.7 |
| 2000 | 13.8 | 27.0 | 21.9 | 43.5 | 35.8 | 14.5 |
| 2010 | 13.3 | 21.4 | 20.2 | 42.1 | 32.1 | 13.0 |
| 2020 | 8.6 | 16.6 | 16.6 | 37.5 | 28.0 | 10.9 |
| 2021 | 7.6 | 16.4 | 16.4 | 37.1 | 27.5 | 11.1 |
This trend suggests that China could face challenges similar to those faced by Japan, which has a vast senior population and significant economic and social implications.
The U.S. registered 11.1 annual births per 1,000 people in 2021, compared to 16.7 in 1990 and 22.8 in 1950. It’s worth noting, however, that the U.S. also adds people to its population through net immigration each year, unlike some other countries in the above dataset.
Nigeria, with the highest birth rate on our list, registered 37.1 annual births per 1,000 people in 2021, compared to 43.8 in 1990 and 45.6 in 1950.
If you enjoyed this post, check out When Will the Global Population Reach Its Peak? This visualization reveals the projected population growth over the next seven decades.
The post Charted: Declining Birth Rates in the Most Populous Countries (1950-Today) appeared first on Visual Capitalist.


