Dorothy Neufeld
2024-08-07 08:11:30
www.visualcapitalist.com
The Growth in U.S. Real Wages, by Income Group
This was originally posted on our Voronoi app. Download the app for free on iOS or Android and discover incredible data-driven charts from a variety of trusted sources.
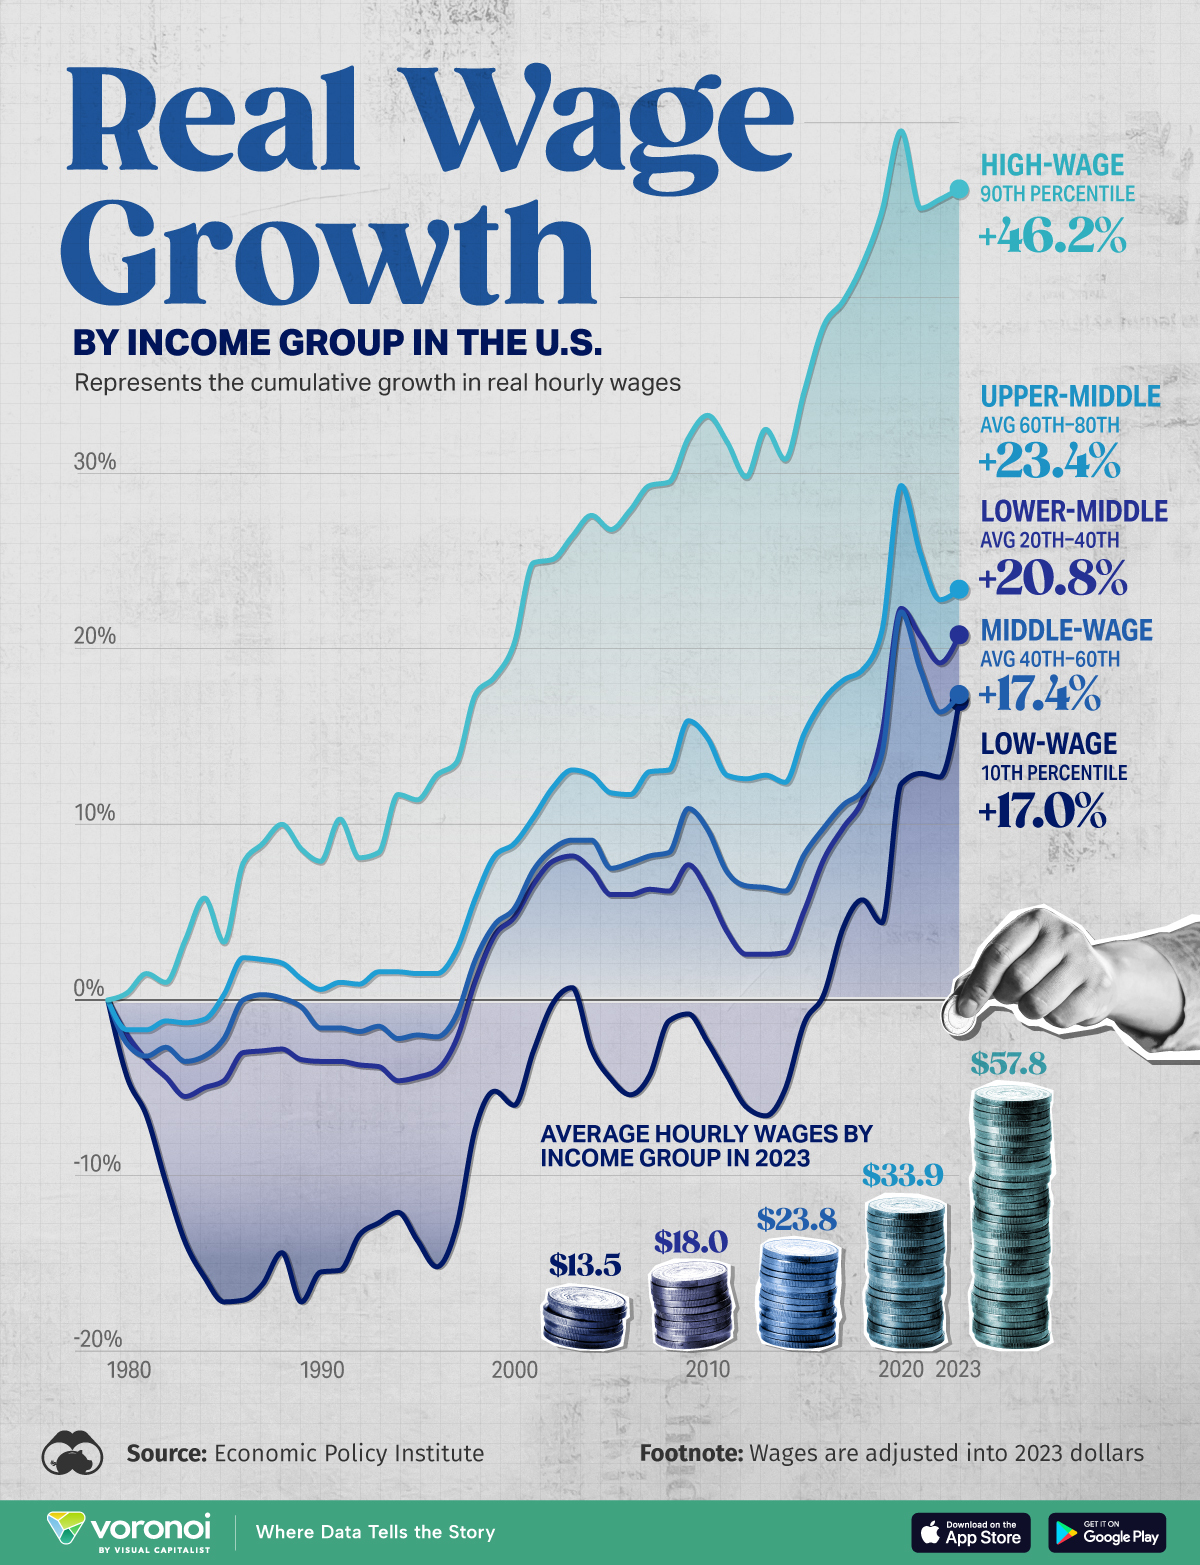
Since 1979, the top income earners in America have seen their real wages grow at more than double the rate of every other income group.
Given this rapid rise, income inequality in the U.S. exceeds nearly every other rich nation, driven by several complex factors. Among these, tax policy, technological change, and economic downturns have widened this gap. Diminishing bargaining power across workers has also contributed to wage disparities.
This graphic shows the growth in real wages over time across income groups, based on data from the Economic Policy Institute.
Stark Differences in Real Wages Over Time
Below, we show the cumulative growth in real wages between 1979 and 2023 by wage group:
| Wage Group | Average Hourly Wage 2023 |
Cumulative % Change in Real Hourly Wages 1979–2023 |
|---|---|---|
| Low-wage (10th percentile) | $13.51 | 17.0% |
| Lower-middle-wage (avg 20th–40th) | $18.00 | 20.8% |
| Middle-wage (avg 40th–60th) | $23.79 | 17.4% |
| Upper-middle-wage (avg 60th–80th) | $33.93 | 23.4% |
| High-wage (90th percentile) | $57.81 | 46.2% |
As we can see, the lowest paid workers in America have seen their real wages increase just 17% over the period—averaging a dismal 0.4% annual growth rate.
If we take out the pandemic-era’s period of strong wage growth for low-wage workers, this figure drops to 0.1% between 1979 and 2019. By contrast, real wages boomed at an annualized rate of 2.9% over the pandemic, outpacing wage growth in the previous 40 years combined.
A similar trend of slow wage growth can be seen across all other income groups apart from the highest income earners. This has contributed to the middle-class—those falling between the lowest and highest income quintiles—to shrink from 61% of the population in 1971 to 51% in 2023.
At the same time, the share of lower-income households grew by 27% in 1971 to 30% in 2023, while the share of upper-income households rose from 11% to 19% over the period.
Wage Growth During the Pandemic
As we can see in the table below, high labor demand during the pandemic led to significant wage increases, particularly for lower-income groups:
| Wage Group | Cumulative % Change in Real Hourly Wages 2019-2023 |
|---|---|
| Low-wage (10th percentile) | 12.1% |
| Lower-middle-wage (avg 20th–40th) | 5.0% |
| Middle-wage (avg 40th–60th) | 3.0% |
| Upper-middle-wage (avg 60th–80th) | 2.0% |
| High-wage (90th percentile) | 0.9% |
What is notable about these wage gains is that they outpaced inflation, which totaled nearly 20% over this period.
Today, a strong labor market is continuing to push real wages above inflation as price pressures have eased, but this growth has slowed considerably since pandemic peaks. In June 2024, year-over-year real wage growth was 0.8% on average, compared to 7.7% in April 2020.
The post Charted: Growth in U.S. Real Wages, by Income Group (1979-2023) appeared first on Visual Capitalist.
Support Techcratic
If you find value in our blend of original insights (Techcratic articles and Techs Got To Eat), up-to-date daily curated articles, and the extensive technical work required to keep everything running smoothly, consider supporting Techcratic with Bitcoin. Your support helps me, as a solo operator, continue delivering high-quality content while managing all the technical aspects, from server maintenance to future updates and improvements. I am committed to continually enhancing the site and staying at the forefront of trends to provide the best possible experience. Your generosity and commitment are deeply appreciated. Thank you!
Bitcoin Address:
bc1qlszw7elx2qahjwvaryh0tkgg8y68enw30gpvge
Please verify this address before sending any funds to ensure your donation is directed correctly.
Bitcoin QR Code
Your contribution is vital in supporting my efforts to deliver valuable content and manage the technical aspects of the site. To donate, simply scan the QR code below. Your generosity allows me to keep providing insightful articles and maintaining the server infrastructure that supports them.

Privacy and Security Disclaimer
- No Personal Information Collected: We do not collect any personal information or transaction details when you make a donation via Bitcoin. The Bitcoin address provided is used solely for receiving donations.
- Data Privacy: We do not store or process any personal data related to your Bitcoin transactions. All transactions are processed directly through the Bitcoin network, ensuring your privacy.
- Security Measures: We utilize industry-standard security practices to protect our Bitcoin address and ensure that your donations are received securely. However, we encourage you to exercise caution and verify the address before sending funds.
- Contact Us: If you have any concerns or questions about our donation process, please contact us via the Techcratic Contact form. We are here to assist you.
Disclaimer: As an Amazon Associate, Techcratic may earn from qualifying purchases.


