Dorothy Neufeld
2024-08-28 14:11:35
www.visualcapitalist.com
![]() See this visualization first on the Voronoi app.
See this visualization first on the Voronoi app.
The Decline of U.S. Manufacturing, by Sector
This was originally posted on our Voronoi app. Download the app for free on iOS or Android and discover incredible data-driven charts from a variety of trusted sources.
Between 2002 and 2022, the U.S. lost more than 45,000 manufacturing firms amid evolving global trade dynamics.
While the U.S. was the world’s leading manufacturer up to 2010, production has fallen $2.4 trillion behind China as of 2022. Factors such as trade liberalization, including the North American Free Trade Agreement, and China’s accession to the World Trade Organization in 2001, have contributed to a significant shift in the U.S. industrial base over the past few decades.
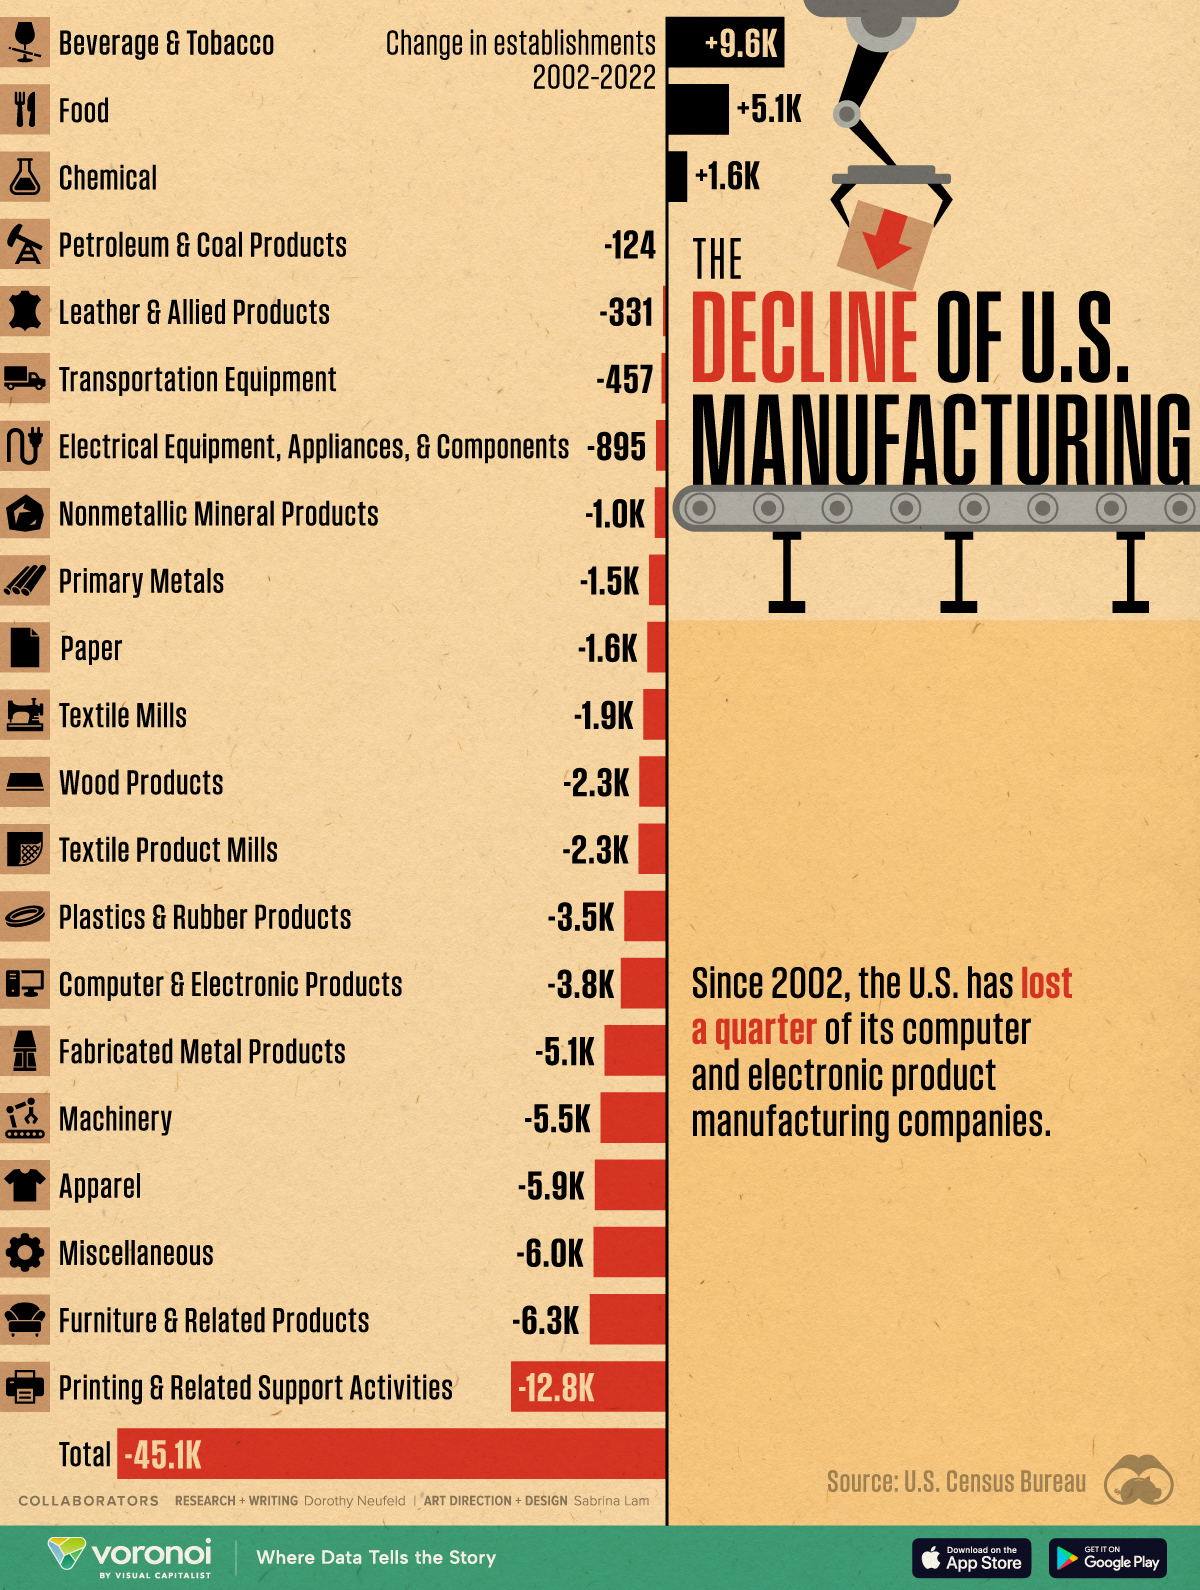
This graphic shows the decline in the number of manufacturing firms by sector over the last 20 years, based on data from the U.S. Census Bureau.
Shrinking Number of Manufacturing Firms
Below, we show the change in manufacturing firms across each of the 21 sub-sectors:
| Sector | Change in # of Establishments | Change (%) |
|---|---|---|
| Beverage and Tobacco | 9,627 | 351% |
| Food | 5,066 | 20% |
| Chemical | 1,636 | 13% |
| Petroleum and Coal Products | -124 | -6% |
| Leather and Allied Products | -331 | -24% |
| Transportation Equipment | -457 | -4% |
| Electrical Equipment, Appliances, and Components | -895 | -14% |
| Nonmetallic Mineral Products | -1,002 | -6% |
| Primary Metals | -1,472 | -29% |
| Paper | -1,616 | -30% |
| Textile Mills | -1,939 | -52% |
| Wood Products | -2,275 | -14% |
| Textile Product Mills | -2,329 | -31% |
| Plastics and Rubber Products | -3,510 | -23% |
| Computer and Electronic Products | -3,792 | -25% |
| Fabricated Metal Products | -5,128 | -9% |
| Machinery | -5,458 | -20% |
| Apparel | -5,932 | -56% |
| Miscellaneous | -6,027 | -20% |
| Furniture and Related Products | -6,342 | -30% |
| Printing and Related Support Activities | -12,798 | -36% |
| Total | -45,098 | -14% |
Overall, the number of U.S. manufacturing firms has shrunk by 14% over 20 years, with 50% or higher drops in the apparel and textile mills sectors.
Amid factory closures across nearly all manufacturing sectors, employment has dropped to 13 million workers as of January 2023, down from its 1979 peak of 19.5 million workers. Today, manufacturing jobs make up roughly 10% of the U.S. private sector workforce.
While manufacturing productivity growth excelled during the 1990s and 2000s, it has lagged over the last decade. Over a third of this slowdown was due to the computer and electronics sector, which was a major driver of productivity growth in previous decades, particularly in semiconductor chips. Since 2002, the number of computer and electronic manufacturing firms has decreased by a quarter.
Similarly, other durable manufacturing sectors like machinery and primary metals (such as steel and aluminum), saw double-digit declines in the number of firms. Despite these closures, U.S. durable goods exports hit a record $1 trillion in 2023, accounting for 63% of all manufacturing exports.
By contrast, beverages and tobacco is one of three sectors with positive growth, driven by the boom in seltzer waters, kombuchas, craft breweries, and craft cocktails. Since 2002, the number of firms has jumped by 351%, adding 9,627 establishments in total.
Learn More on the Voronoi App 
To learn more about this topic from a manufacturing spending perspective, check out this graphic on U.S. manufacturing construction spending by sector.
The post Visualizing the Decline of U.S. Manufacturing, by Sector (2002-2022) appeared first on Visual Capitalist.
Support Techcratic
If you find value in our blend of original insights (Techcratic articles and Techs Got To Eat), up-to-date daily curated articles, and the extensive technical work required to keep everything running smoothly, consider supporting Techcratic with Bitcoin. Your support helps me, as a solo operator, continue delivering high-quality content while managing all the technical aspects, from server maintenance to future updates and improvements. I am committed to continually enhancing the site and staying at the forefront of trends to provide the best possible experience. Your generosity and commitment are deeply appreciated. Thank you!
Bitcoin Address:
bc1qlszw7elx2qahjwvaryh0tkgg8y68enw30gpvge
Please verify this address before sending any funds to ensure your donation is directed correctly.
Bitcoin QR Code
Your contribution is vital in supporting my efforts to deliver valuable content and manage the technical aspects of the site. To donate, simply scan the QR code below. Your generosity allows me to keep providing insightful articles and maintaining the server infrastructure that supports them.

Privacy and Security Disclaimer
- No Personal Information Collected: We do not collect any personal information or transaction details when you make a donation via Bitcoin. The Bitcoin address provided is used solely for receiving donations.
- Data Privacy: We do not store or process any personal data related to your Bitcoin transactions. All transactions are processed directly through the Bitcoin network, ensuring your privacy.
- Security Measures: We utilize industry-standard security practices to protect our Bitcoin address and ensure that your donations are received securely. However, we encourage you to exercise caution and verify the address before sending funds.
- Contact Us: If you have any concerns or questions about our donation process, please contact us via the Techcratic Contact form. We are here to assist you.
Disclaimer: As an Amazon Associate, Techcratic may earn from qualifying purchases.


![OQTIQ Windshield Phone Mount for Car [Gooseneck 13″ Long Arm] Car Phone Holder Mount…](https://techcratic.com/wp-content/uploads/2024/11/61p78dnmiL._AC_SL1500_-360x180.jpg)


![Trolls Holiday [DVD]](https://techcratic.com/wp-content/uploads/2024/11/718ptSfcL._SL1500_-360x180.jpg)


