


![Coal Miner’s Daughter [Blu-ray]](https://techcratic.com/wp-content/uploads/2024/09/71Qkqym1itL._SL1500_-360x180.jpg)


Pallavi Rao
2024-08-29 08:12:26
www.visualcapitalist.com
Mapped: The Share of Each State’s Population That Lives in Cities
This was originally posted on our Voronoi app. Download the app for free on iOS or Android and discover incredible data-driven charts from a variety of trusted sources.
Since the Industrial Revolution, the U.S. (along with much of the rest of the world) has urbanized. Currently almost 80% of the entire country’s population lives in cities.
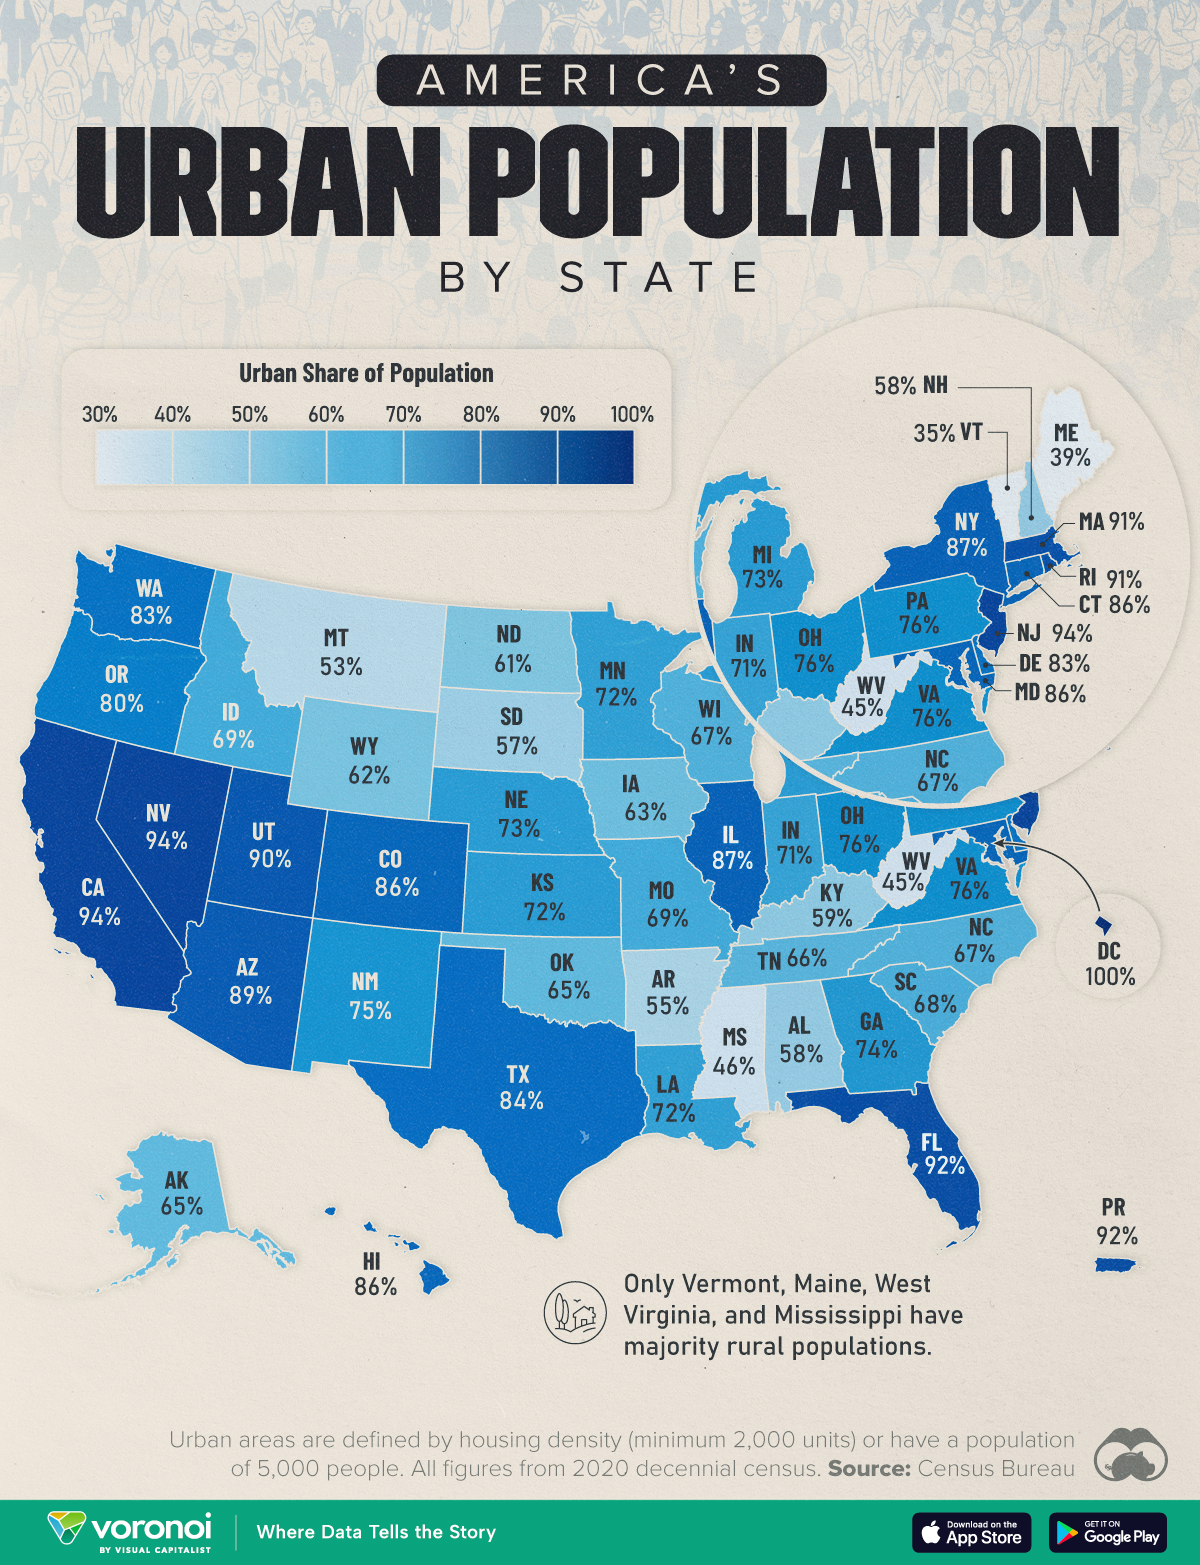
However country-wide statistics can mask variations between regions. This graphic maps the share of urban population by state, per latest estimates from the Census Bureau. According to them, an urban area must “encompass at least 2,000 housing units or have a population of at least 5,000 people.”
The States with the Highest Share of Urban Populations
For seven U.S. states, (California, Nevada, New Jersey, Florida, Massachusetts, Rhode Island, and Utah), 90% or more of the population lives in cities. They also tend to have large urban centers, with 250,000 or more residents.
| Rank | State | Urban Population | Rural Population |
|---|---|---|---|
| 1 | Washington D.C.* | 100% | 0% |
| 2 | California | 94% | 6% |
| 3 | Nevada | 94% | 6% |
| 4 | New Jersey | 94% | 6% |
| 5 | Puerto Rico** | 92% | 8% |
| 6 | Florida | 92% | 8% |
| 7 | Massachusetts | 91% | 9% |
| 8 | Rhode Island | 91% | 9% |
| 9 | Utah | 90% | 10% |
| 10 | Arizona | 89% | 11% |
| 11 | New York | 87% | 13% |
| 12 | Illinois | 87% | 13% |
| 13 | Connecticut | 86% | 14% |
| 14 | Hawaii | 86% | 14% |
| 15 | Colorado | 86% | 14% |
| 16 | Maryland | 86% | 14% |
| 17 | Texas | 84% | 16% |
| 18 | Washington | 83% | 17% |
| 19 | Delaware | 83% | 17% |
| 20 | Oregon | 80% | 20% |
| 21 | Pennsylvania | 76% | 24% |
| 22 | Ohio | 76% | 24% |
| 23 | Virginia | 76% | 24% |
| 24 | New Mexico | 75% | 25% |
| 25 | Georgia | 74% | 26% |
| 26 | Michigan | 73% | 27% |
| 27 | Nebraska | 73% | 27% |
| 28 | Kansas | 72% | 28% |
| 29 | Minnesota | 72% | 28% |
| 30 | Louisiana | 72% | 28% |
| 31 | Indiana | 71% | 29% |
| 32 | Missouri | 69% | 31% |
| 33 | Idaho | 69% | 31% |
| 34 | South Carolina | 68% | 32% |
| 35 | Wisconsin | 67% | 33% |
| 36 | North Carolina | 67% | 33% |
| 37 | Tennessee | 66% | 34% |
| 38 | Alaska | 65% | 35% |
| 39 | Oklahoma | 65% | 35% |
| 40 | Iowa | 63% | 37% |
| 41 | Wyoming | 62% | 38% |
| 42 | North Dakota | 61% | 39% |
| 43 | Kentucky | 59% | 41% |
| 44 | New Hampshire | 58% | 42% |
| 45 | Alabama | 58% | 42% |
| 46 | South Dakota | 57% | 43% |
| 47 | Arkansas | 55% | 45% |
| 48 | Montana | 53% | 47% |
| 49 | Mississippi | 46% | 54% |
| 50 | West Virginia | 45% | 55% |
| 51 | Maine | 39% | 61% |
| 52 | Vermont | 35% | 65% |
*Federal district. **U.S. territory. Figures rounded.
Puerto Rico’s populace is also 92% urban, and of course Washington D.C. has the rare distinction of being entirely (100%) urban.
Looking at the map, it’s possible to see some patterns in urban populations. The West Coast, for example, is all uniformly a darker blue, indicating a higher population share living in cities. The same can be said for most of the East Coast.
The less-populated Mountain and Midwest states (Montana, Wyoming, and the Dakotas) are more balanced with a 60-40 urban-rural split. In Midwestern states like Minnesota, Indiana, and Ohio, the urban share begins to grow.
Only four states, Vermont, Maine, West Virginia, and Mississippi have majority rural populations in the entire country.
The latter two, along with other states with a higher share of rural residents (including Arkansas, Kentucky, and Alabama) tend to have higher poverty rates as well.
Importantly, these are all percentage shares of a state population. So the more populous states (California, Texas, New York) still have rural residents who’d outnumber entire parts of the country.
Learn More on the Voronoi App 
The Census Bureau collects a wealth of information about Americans. Check out Obesity Rates by State for a look at other regional patterns in the country.
The post Mapped: How Much of Each U.S. State’s Population Lives in Cities appeared first on Visual Capitalist.
Support Techcratic
If you find value in our blend of original insights (Techcratic articles and Techs Got To Eat), up-to-date daily curated articles, and the extensive technical work required to keep everything running smoothly, consider supporting Techcratic with Bitcoin. Your support helps me, as a solo operator, continue delivering high-quality content while managing all the technical aspects, from server maintenance to future updates and improvements. I am committed to continually enhancing the site and staying at the forefront of trends to provide the best possible experience. Your generosity and commitment are deeply appreciated. Thank you!
Bitcoin Address:
bc1qlszw7elx2qahjwvaryh0tkgg8y68enw30gpvge
Please verify this address before sending any funds to ensure your donation is directed correctly.
Bitcoin QR Code
Your contribution is vital in supporting my efforts to deliver valuable content and manage the technical aspects of the site. To donate, simply scan the QR code below. Your generosity allows me to keep providing insightful articles and maintaining the server infrastructure that supports them.

Privacy and Security Disclaimer
- No Personal Information Collected: We do not collect any personal information or transaction details when you make a donation via Bitcoin. The Bitcoin address provided is used solely for receiving donations.
- Data Privacy: We do not store or process any personal data related to your Bitcoin transactions. All transactions are processed directly through the Bitcoin network, ensuring your privacy.
- Security Measures: We utilize industry-standard security practices to protect our Bitcoin address and ensure that your donations are received securely. However, we encourage you to exercise caution and verify the address before sending funds.
- Contact Us: If you have any concerns or questions about our donation process, please contact us via the Techcratic Contact form. We are here to assist you.
Disclaimer: As an Amazon Associate, Techcratic may earn from qualifying purchases.


