Alan Kennedy
2024-10-03 13:56:29
www.visualcapitalist.com
Range Disclosures
The Rise of U.S. Natural Gas Exports
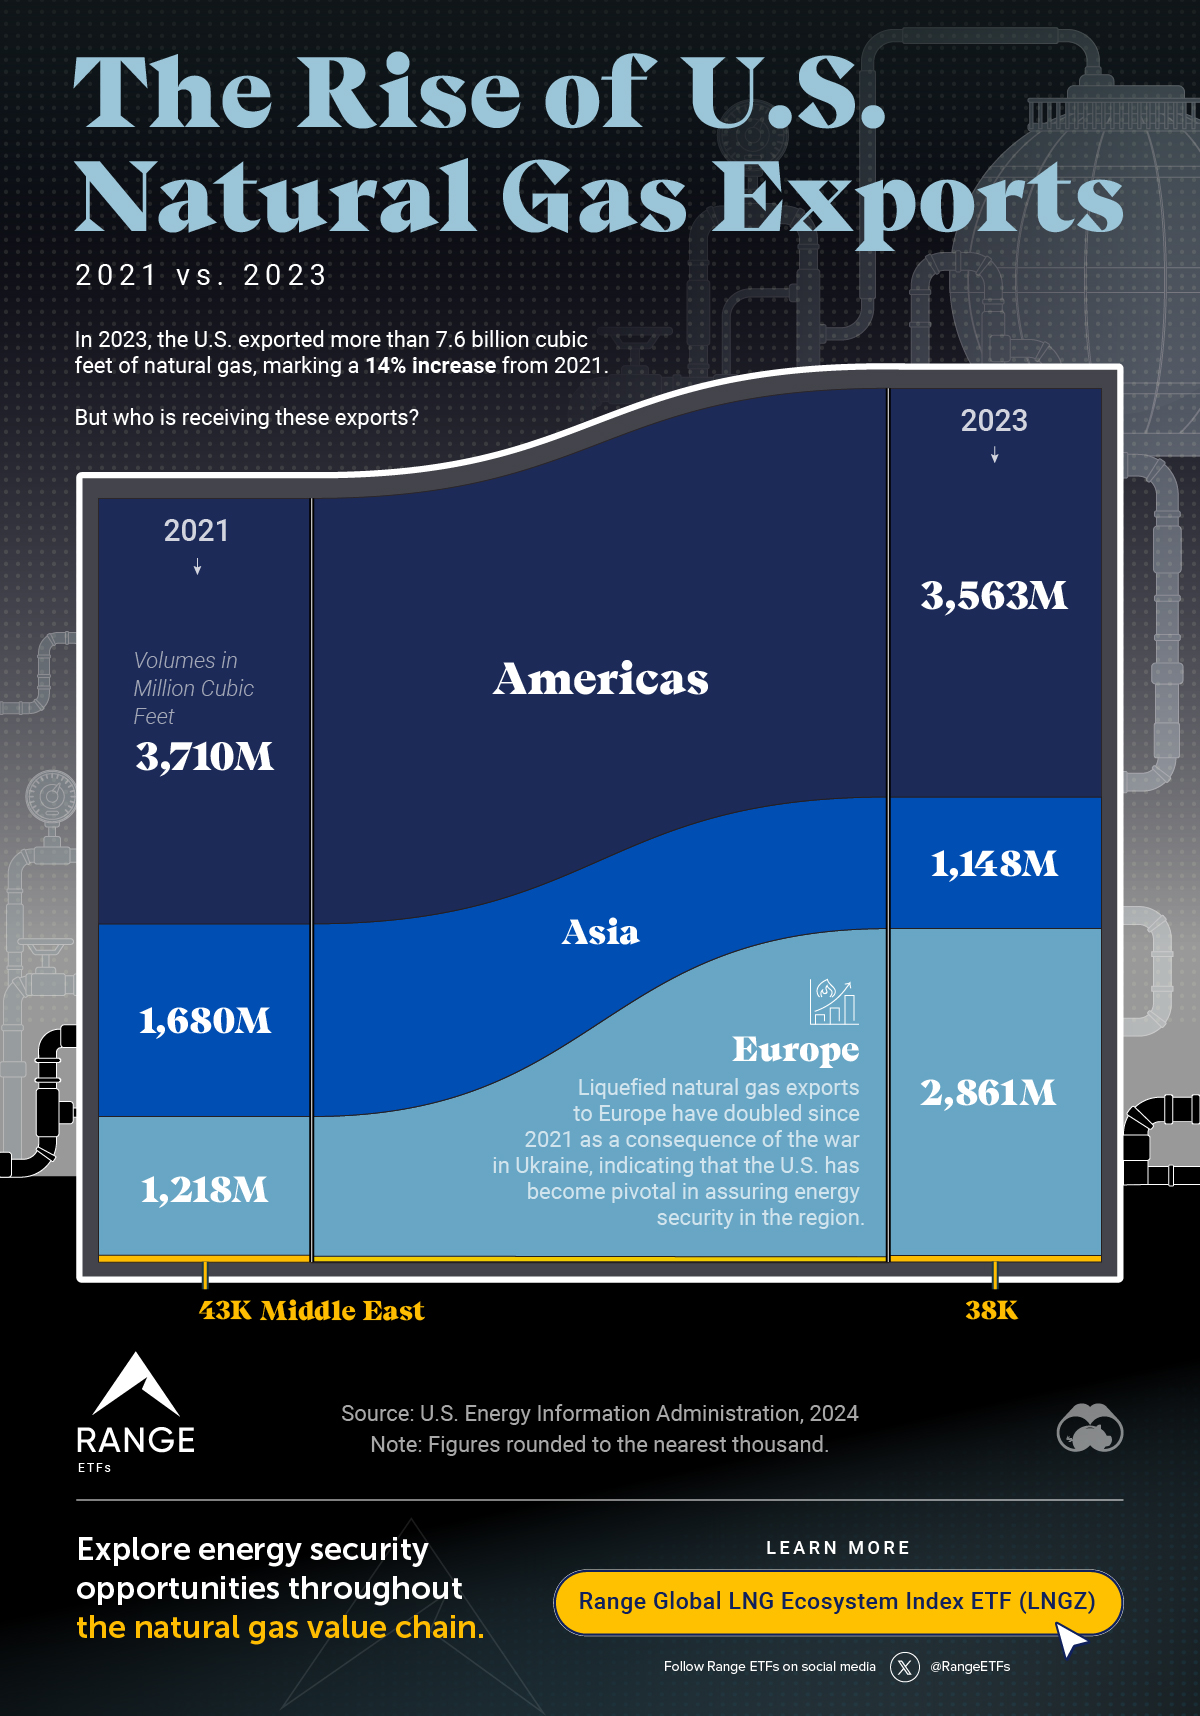
Since 2021, the U.S. has increased the volume of natural gas it has exported. In fact, according to the U.S. Energy Information Administration, liquefied natural gas (LNG) exports have increased by 14% since 2021 to over 7.8 billion cubic feet.
For this graphic, Visual Capitalist has partnered with Range ETFs to explore the growth of U.S. LNG exports and the driving forces behind them.
The Changing Face of U.S. Gas Exports
Energy security is one of the primary reasons the U.S. has increased its LNG exports. After Russia invaded Ukraine, the U.S. moved to replace natural gas streams in Europe that had been cut off by Russia and provide the region with greater energy security.
Consequently, the U.S. increased LNG exports to many European countries while decreasing exports to others. The table below compares the volume of LNG exported by the U.S. in 2021 to the volume exported in 2023 in millions of cubic feet:
| Nation | 2021 | 2023 | Region | % Change |
|---|---|---|---|---|
 Mexico Mexico |
2,154,457 | 2,241,553 | Americas | 4.0% |
 Canada Canada |
937,124 | 1,026,097 | Americas | 9.5% |
 Netherlands Netherlands |
174,339 | 588,557 | Europe | 237.6% |
 France France |
170,780 | 492,696 | Europe | 188.5% |
 United Kingdom United Kingdom |
195,046 | 450,694 | Europe | 131.1% |
 Japan Japan |
354,948 | 310,190 | Asia | -12.6% |
 South Korea South Korea |
453,483 | 275,779 | Asia | -39.2% |
 Spain Spain |
215,062 | 269,202 | Europe | 25.2% |
 Germany Germany |
0 | 204,605 | Europe | N/A |
 Italy Italy |
34,210 | 197,513 | Europe | 477.4% |
 China China |
453,304 | 173,247 | Asia | -61.8% |
 India India |
196,218 | 164,325 | Asia | -16.3% |
 Türkiye Türkiye |
188,849 | 156,403 | Europe | -17.2% |
 Poland Poland |
56,320 | 139,635 | Europe | 147.9% |
 Taiwan Taiwan |
99,350 | 104,075 | Asia | 4.8% |
 Belgium Belgium |
5,584 | 97,017 | Europe | 1637.4% |
 Argentina Argentina |
83,449 | 76,921 | Americas | -7.8% |
 Dominican Republic Dominican Republic |
53,095 | 73,761 | Americas | 38.9% |
 Portugal Portugal |
65,865 | 73,158 | Europe | 11.1% |
 Thailand Thailand |
14,548 | 59,477 | Asia | 308.8% |
 Croatia Croatia |
36,133 | 55,439 | Europe | 53.4% |
 Lithuania Lithuania |
30,919 | 55,332 | Europe | 79.0% |
 Greece Greece |
39,708 | 39,426 | Europe | -0.7% |
 Finland Finland |
0 | 38,858 | Europe | N/A |
 Brazil Brazil |
307,714 | 38,595 | Americas | -87.5% |
 Kuwait Kuwait |
34,476 | 35,185 | Middle East | 2.1% |
 Colombia Colombia |
2,247 | 32,014 | Americas | 1324.7% |
 Chile Chile |
121,881 | 31,217 | Americas | -74.4% |
 Bangladesh Bangladesh |
37,734 | 24,147 | Asia | -36.0% |
 Singapore Singapore |
20,918 | 23,320 | Asia | 11.5% |
 Panama Panama |
8,436 | 19,565 | Americas | 131.9% |
 Jamaica Jamaica |
25,276 | 9,048 | Americas | -64.2% |
 Philippines Philippines |
0 | 6,823 | Asia | N/A |
 Jordan Jordan |
0 | 3,282 | Middle East | N/A |
 Indonesia Indonesia |
3,269 | 3,157 | Asia | -3.4% |
 Pakistan Pakistan |
45,818 | 3,141 | Asia | -93.1% |
 Malta Malta |
5,427 | 2,592 | Europe | -52.2% |
 Bahamas Bahamas |
486 | 499 | Americas | 2.7% |
 Haiti Haiti |
137 | 113 | Americas | -17.5% |
 Antigua and Barbuda Antigua and Barbuda |
8 | 47 | Americas | 487.5% |
 Barbados Barbados |
297 | 11 | Americas | -96.3% |
 Israel Israel |
8,906 | 0 | Middle East | -100.0% |
U.S. LNG exports to Europe as a whole have doubled since 2021, but exports to some select countries have skyrocketed. For example, France and the Netherlands doubled their imports, Italy’s imports grew nearly fivefold, while Belgium imported a staggering 16 times more LNG from the U.S. in 2023 than it did in 2021.
The U.S. also now exports LNG to countries it did not export to before 2021. Germany, for example, did not import LNG from the U.S. in 2021 but was the 9th highest importer of U.S. LNG in 2023.
Natural Gas: Providing Energy Security
According to a recent forecast from Shell, the global demand for LNG will grow by 50% further by 2040. This growth would likely be driven by energy security demands in places like Europe and as regions like Asia transition away from coal and begin to use LNG more frequently.
Are you interested in exploring the investment opportunities provided by natural gas?
The Range Global LNG Ecosystem ETF (LNGZ) offers energy investors opportunities throughout the natural gas value chain.

Learn more about the Range Global LNG Ecosystem ETF (LNGZ)
-

 Mining3 days ago
Visualizing the Decline of Copper Usage in EVs
The total copper per vehicle is projected to decrease by 38 kg between 2015 and 2030.
-
 Energy7 days ago
Charted: Lithium-Ion Batteries Keep Getting Cheaper
Cell prices have fallen 73% since 2014.
-
 Energy2 weeks ago
Ranked: The Largest Producers of Wind Power, by Country
Global wind power capacity hit fresh records in 2023 thanks to strategic government investment and lower technology costs.
-
 Green2 weeks ago
Chart: Coal Consumption by Region (1965-2023)
China remains the largest coal consumer, making up 56% of the global total.
-
 Urbanization3 weeks ago
Charted: China’s Energy Needs Keep on Rising
After rapid industrialization in the 1990s, mass urbanization is driving demand even higher.
-
 Green4 weeks ago
Charted: The World’s Carbon Emissions from Energy Production
The energy sector is the main contributor of greenhouse gas emissions globally. Which countries’ energy sector emits the most CO2?
The post Charted: U.S. Natural Gas Exports (2021 vs. 2023) appeared first on Visual Capitalist.
Support Techcratic
If you find value in Techcratic’s insights and articles, consider supporting us with Bitcoin. Your support helps me, as a solo operator, continue delivering high-quality content while managing all the technical aspects, from server maintenance to blog writing, future updates, and improvements. Support Innovation! Thank you.
Bitcoin Address:
bc1qlszw7elx2qahjwvaryh0tkgg8y68enw30gpvge
Please verify this address before sending funds.
Bitcoin QR Code
Simply scan the QR code below to support Techcratic.

Please read the Privacy and Security Disclaimer on how Techcratic handles your support.
Disclaimer: As an Amazon Associate, Techcratic may earn from qualifying purchases.


![Roblox Pressure | THE RAVEYARD [Full Walkthrough]](https://techcratic.com/wp-content/uploads/2024/12/1734837320_maxresdefault-360x180.jpg)


![[2024 Upgrade] INSAUTO Tesla Model Y Windshield Sunshade Umbrella-Protect Car from Sun…](https://techcratic.com/wp-content/uploads/2024/12/61aJHRkDWTL._AC_SL1392_-360x180.jpg)


