Pallavi Rao
2024-10-17 02:19:00
www.visualcapitalist.com
![]() See this visualization first on the Voronoi app.
See this visualization first on the Voronoi app.
Breaking Down the Global Shipbuilding Industry, by Country
This was originally posted on our Voronoi app. Download the app for free on iOS or Android and discover incredible data-driven charts from a variety of trusted sources.
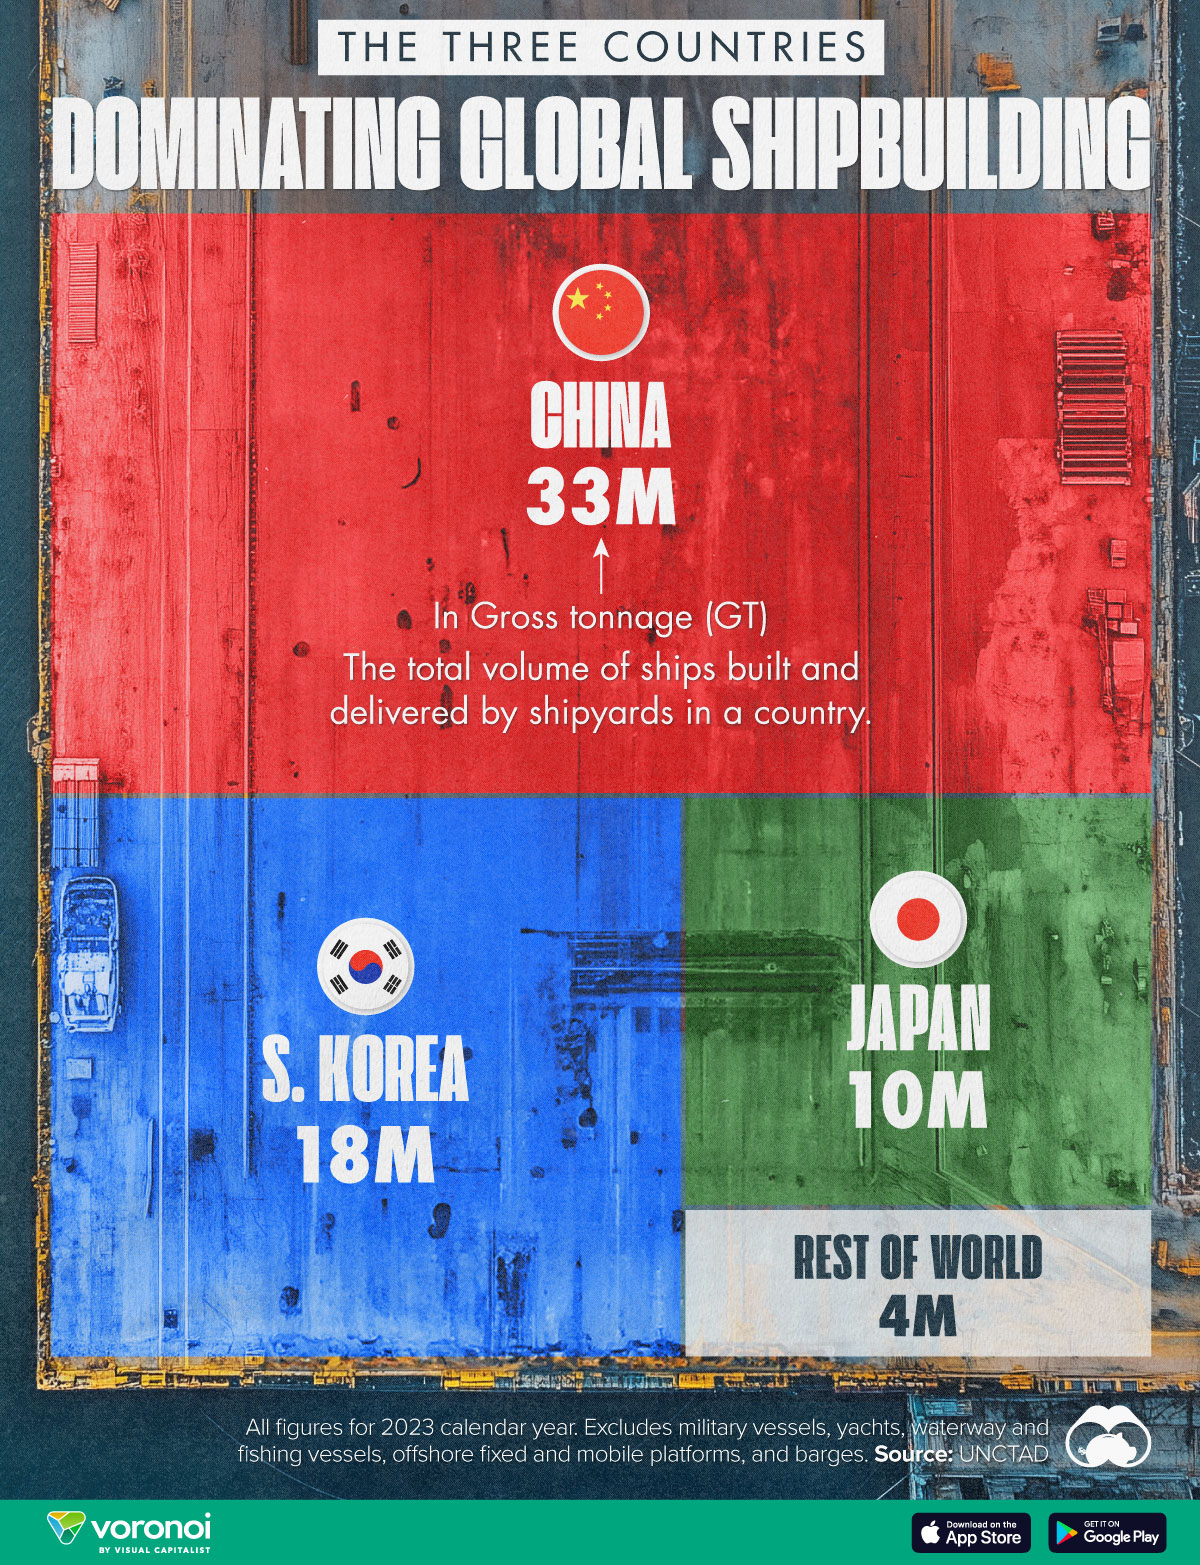
This chart breaks down the major players in shipbuilding, by the gross tonnage (GT) of merchant ships built in 2023.
Gross Tonnage (GT) measures the internal volume of a ship and is not related to the ship’s weight, but rather its overall size and capacity.
A very large container ship with a capacity of around 20,250 TEUs (Twenty-foot Equivalent Units) would have 220,000 GT.
Data for this chart is sourced from UN Trade and Development (UNCTAD) and excludes military vessels, yachts, fishing vessels, offshore platforms, and barges. Figures are rounded.
Asia Builds the World’s Ships
China built more than half of all the world’s merchant ships by gross tonnage (33 million GT) in 2023. This translates into 150 of the world’s largest container ships.
We list the top 15 shipbuilding countries here, most of them are combined into one “rest-of-world” category in the graphic since their share is so small.
| Rank | Country | Gross Tonnage (2023) | Share of Total |
|---|---|---|---|
| 1 |  China China |
32,859,862 | 51% |
| 2 |  South Korea South Korea |
18,317,886 | 28% |
| 3 |  Japan Japan |
9,965,182 | 15% |
| 4 |  Philippines Philippines |
805,938 | 1% |
| 5 |  Italy Italy |
402,164 | 0.62% |
| 6 |  France France |
326,680 | 0.50% |
| 7 |  Germany Germany |
289,666 | 0.45% |
| 8 |  Finland Finland |
261,654 | 0.40% |
| 9 |  Taiwan Taiwan |
187,558 | 0.29% |
| 10 |  Russia Russia |
177,571 | 0.27% |
| 11 |  Netherlands Netherlands |
90,596 | 0.14% |
| 12 |  Türkiye Türkiye |
79,032 | 0.12% |
| 13 |  Indonesia Indonesia |
75,979 | 0.12% |
| 14 |  U.S. U.S. |
64,809 | 0.10% |
| 15 |  Iran Iran |
64,760 | 0.09% |
| N/A |  World World |
64,774,769 | N/A |
South Korea (18 million GT) and Japan (10 million GT) are also major players in the shipbuilding industry. Put together these three countries account for 95% of the entire industry.
China’s domination is particularly mind-boggling. It’s been the leading shipbuilder for 14 straight years. In fact, in 2007 it was behind both Japan and South Korea; by 2010 it had leapfrogged both countries.
The sector’s growth—and general economic growth in the country—coincided with China’s ascension to the WTO in 2001. Chinese manufacturing in multiple sectors exploded and its exports skyrocketed, helping it become the world’s second-largest economy in 2010.
China’s shipbuilding prowess hit a wobble in 2008, when the recession forced hundreds of yard closures. Since then, however, shipyards have changed focus: not so much on bulk carriers but to “high value ships” like cruise ships and LNG carriers.
Learn More on the Voronoi App 
Need more data to understand the Chinese economy? Check out The Rapid Decline of China’s Private Sector to see how and why venture capital is drying up in the country.
The post Ranked: The Countries That Dominate Global Shipbuilding appeared first on Visual Capitalist.
Support Techcratic
If you find value in Techcratic’s insights and articles, consider supporting us with Bitcoin. Your support helps me, as a solo operator, continue delivering high-quality content while managing all the technical aspects, from server maintenance to blog writing, future updates, and improvements. Support Innovation! Thank you.
Bitcoin Address:
bc1qlszw7elx2qahjwvaryh0tkgg8y68enw30gpvge
Please verify this address before sending funds.
Bitcoin QR Code
Simply scan the QR code below to support Techcratic.

Please read the Privacy and Security Disclaimer on how Techcratic handles your support.
Disclaimer: As an Amazon Associate, Techcratic may earn from qualifying purchases.


![Pioneer [Blu-ray]](https://techcratic.com/wp-content/uploads/2024/11/81EmJG9mivL._SL1500_-360x180.jpg)


