Pallavi Rao
2024-10-23 08:02:00
www.visualcapitalist.com
Mapped: How Each U.S. State’s GDP Per Capita Compares
This was originally posted on our Voronoi app. Download the app for free on iOS or Android and discover incredible data-driven charts from a variety of trusted sources.
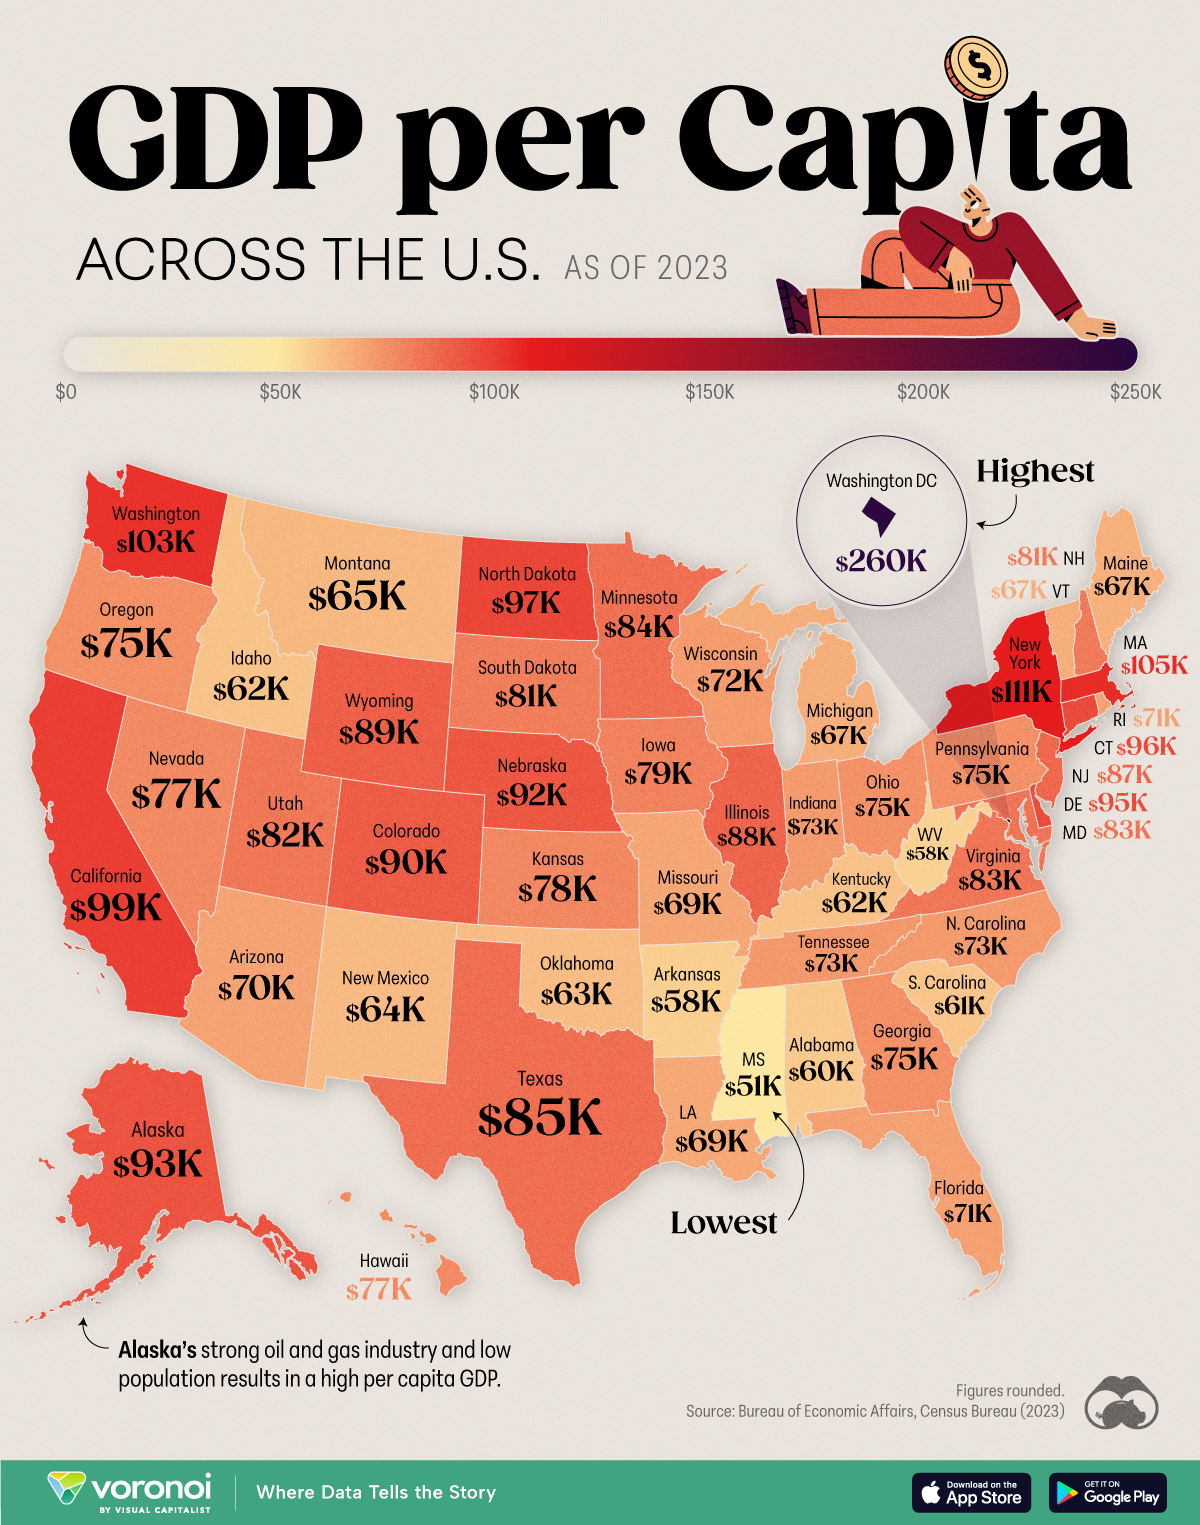
This map lists every U.S. state’s GDP per capita, with darker hues signifying a higher number. Data was sourced from the Bureau of Economic Affairs and the Census Bureau, as of 2023.
As a metric, GDP per capita can provide an indication of the standard of living and overall prosperity of an area. Higher values typically reflect greater wealth, productivity, and access to goods and services on a per-person basis.
Ranked: Which State has the Highest GDP per Capita?
Washington D.C. has the highest per capita GDP in the U.S., at nearly $260,000. For reference, it’s more than $100,000 higher than Luxembourg—the richest country in the world by the same metric.
| Rank | State | GDP per Capita (2023) |
|---|---|---|
| 1 | Washington D.C. | $259,954 |
| 2 | New York | $110,980 |
| 3 | Massachusetts | $105,164 |
| 4 | Washington | $103,402 |
| 5 | California | $99,329 |
| 6 | North Dakota | $97,003 |
| 7 | Connecticut | $95,630 |
| 8 | Delaware | $95,038 |
| 9 | Alaska | $92,794 |
| 10 | Nebraska | $91,633 |
| 11 | Colorado | $90,109 |
| 12 | Wyoming | $89,016 |
| 13 | Illinois | $87,520 |
| 14 | New Jersey | $86,824 |
| 15 | Texas | $84,708 |
| 16 | Minnesota | $84,205 |
| 17 | Maryland | $83,428 |
| 18 | Virginia | $82,598 |
| 19 | Utah | $82,315 |
| 20 | New Hampshire | $81,381 |
| 21 | South Dakota | $80,531 |
| 22 | Iowa | $79,212 |
| 23 | Kansas | $77,616 |
| 24 | Nevada | $77,009 |
| 25 | Hawaii | $76,833 |
| 26 | Georgia | $75,420 |
| 27 | Pennsylvania | $75,327 |
| 28 | Oregon | $75,327 |
| 29 | Ohio | $75,075 |
| 30 | Tennessee | $73,393 |
| 31 | Indiana | $72,791 |
| 32 | North Carolina | $72,734 |
| 33 | Wisconsin | $72,484 |
| 34 | Florida | $70,799 |
| 35 | Rhode Island | $70,782 |
| 36 | Arizona | $70,346 |
| 37 | Missouri | $69,416 |
| 38 | Louisiana | $68,869 |
| 39 | Vermont | $67,237 |
| 40 | Michigan | $67,132 |
| 41 | Maine | $66,826 |
| 42 | Montana | $64,666 |
| 43 | New Mexico | $63,853 |
| 44 | Oklahoma | $63,320 |
| 45 | Kentucky | $61,798 |
| 46 | Idaho | $61,565 |
| 47 | South Carolina | $60,932 |
| 48 | Alabama | $59,692 |
| 49 | Arkansas | $58,221 |
| 50 | West Virginia | $57,711 |
| 51 | Mississippi | $51,416 |
Note: Figures rounded.
There are some general patterns to glean from the above map. For example, states with major metropolitan areas (e.g., California, New York, Illinois) usually see higher GDP per capita due to concentrated economic activity.
And states rich in natural resources with smaller populations (Alaska, Wyoming, North Dakota), also have high figures despite limited economic diversification.
Another interesting one is Delaware, where a small population and high value industry—financial services—combine for a high per capita GDP.
On the other hand, Southern states, (Mississippi and Arkansas), have a lower GDP per capita, partly due to a reliance on lower-wage industries (agriculture and meatpacking).
Learn More on the Voronoi App 
A higher GDP per capita can also mean higher costs of living. Check out The Income Needed to Live Comfortably in Every State for more correlations.
The post Mapped: U.S. States by GDP per Capita appeared first on Visual Capitalist.
Support Techcratic
If you find value in Techcratic’s insights and articles, consider supporting us with Bitcoin. Your support helps me, as a solo operator, continue delivering high-quality content while managing all the technical aspects, from server maintenance to blog writing, future updates, and improvements. Support Innovation! Thank you.
Bitcoin Address:
bc1qlszw7elx2qahjwvaryh0tkgg8y68enw30gpvge
Please verify this address before sending funds.
Bitcoin QR Code
Simply scan the QR code below to support Techcratic.

Please read the Privacy and Security Disclaimer on how Techcratic handles your support.
Disclaimer: As an Amazon Associate, Techcratic may earn from qualifying purchases.


![Friends: The Complete Series (4K UltraHD) [4K UHD]](https://techcratic.com/wp-content/uploads/2024/11/71zFLJVDUeL._SL1500_-360x180.jpg)


![#UFO FLEET | MUFON CASE # 106156 [MUST SEE] Louisiana](https://techcratic.com/wp-content/uploads/2024/11/1732148641_maxresdefault-360x180.jpg)


