Kayla Zhu
2024-10-25 08:09:00
www.visualcapitalist.com
Retirement-Age Adults (65 and Older) Still Working By State
This was originally posted on our Voronoi app. Download the app for free on iOS or Android and discover incredible data-driven charts from a variety of trusted sources.
More and more older adults in the U.S. are choosing to continue to work well into their retirement years.
Overall growth in the 65 and older population, higher cost of living, and various social factors have led to a growing share of older adults in the American workforce.
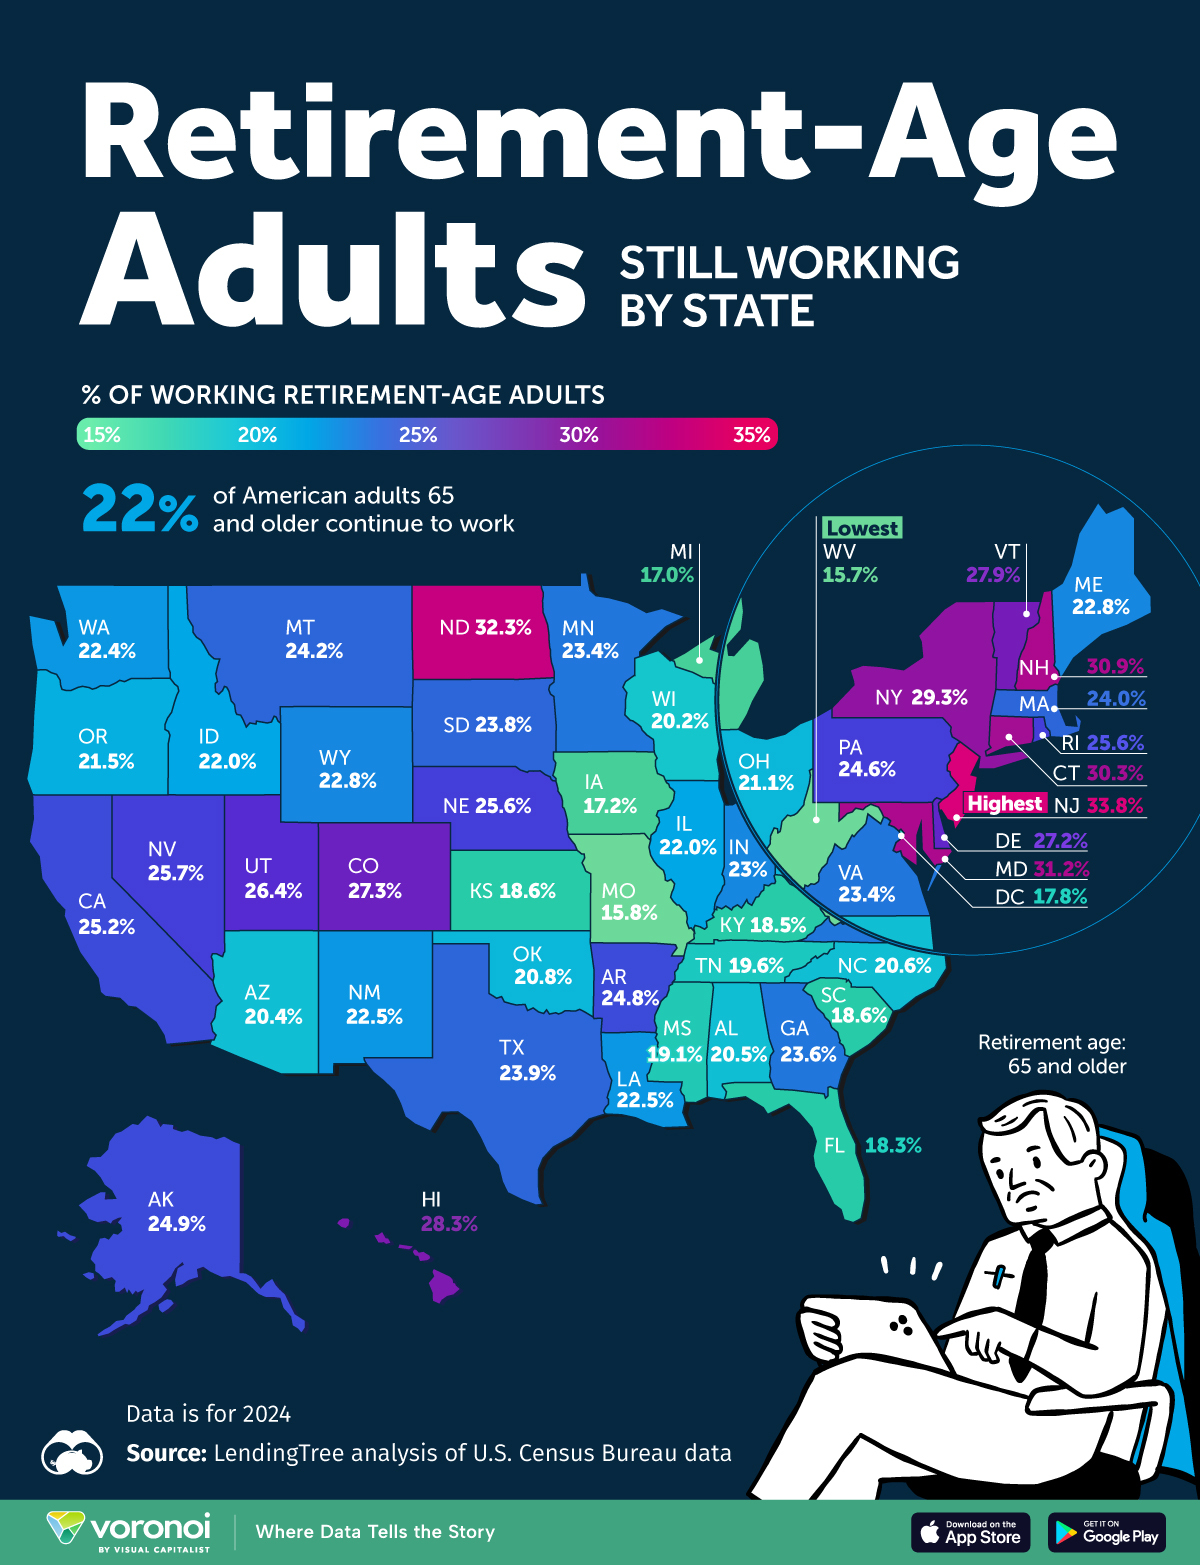
This map shows the percentage of U.S. adults 65 and older who are still working by state using figures from a LendingTree analysis of U.S. Census Bureau data.
States With the Highest Share of Retirement-Age Workers
Below, we show the percentage of adults 65 and older in each state that are still working.
| State | Share of working retirement-age adults |
|---|---|
| New Jersey | 33.8% |
| North Dakota | 32.3% |
| Maryland | 31.2% |
| New Hampshire | 30.9% |
| Connecticut | 30.3% |
| New York | 29.3% |
| Hawaii | 28.3% |
| Vermont | 27.9% |
| Colorado | 27.3% |
| Delaware | 27.2% |
| Utah | 26.4% |
| Nevada | 25.7% |
| Nebraska | 25.6% |
| Rhode Island | 25.6% |
| California | 25.2% |
| Alaska | 24.9% |
| Arkansas | 24.8% |
| Pennsylvania | 24.6% |
| Montana | 24.2% |
| Massachusetts | 24.0% |
| Texas | 23.9% |
| South Dakota | 23.8% |
| Georgia | 23.6% |
| Minnesota | 23.4% |
| Virginia | 23.4% |
| Indiana | 23.0% |
| Maine | 22.8% |
| Wyoming | 22.8% |
| Louisiana | 22.5% |
| New Mexico | 22.5% |
| Washington | 22.4% |
| Idaho | 22.0% |
| Illinois | 22.0% |
| Oregon | 21.5% |
| Ohio | 21.1% |
| Oklahoma | 20.8% |
| North Carolina | 20.6% |
| Alabama | 20.5% |
| Arizona | 20.4% |
| Wisconsin | 20.2% |
| Tennessee | 19.6% |
| Mississippi | 19.1% |
| Kansas | 18.6% |
| South Carolina | 18.6% |
| Kentucky | 18.5% |
| Florida | 18.3% |
| District of Columbia | 17.8% |
| Iowa | 17.2% |
| Michigan | 17.0% |
| Missouri | 15.8% |
| West Virginia | 15.7% |
About 22% of American adults 65 and older continue to work in 2024. About a quarter of working retirement-age adults are self-employed, according to census data.
Some older workers choose to remain employed for a sense of purpose, identity, or to keep their routine intact. Additionally, older adults today tend to be healthier overall compared to the past, allowing them to remain in the workforce longer.
For others, this decision came out of financial necessity. According to the Federal Reserve, in 2022 only 51% of American adults 65 to 74 had a retirement account. For adults 75 and older, this figure was even lower, at 42%.
The Northeast region tends to have higher rates of retirement-age adults still working, with every single state all above the national average of 22%.
New Jersey saw the highest share of working adults over the age of 65 in 2024, and the largest two-year increase. In March 2022, 20.3% of Americans 65 and older were employed in New Jersey. Two years later, in March 2024, this figure had risen to 33.8%.
Learn More on the Voronoi App 
To learn more about other U.S. labor trends, graphic that shows the share of workers with paid sick leave access by U.S. region.
The post Mapped: Retirement-Age Workers by U.S. State appeared first on Visual Capitalist.
Support Techcratic
If you find value in Techcratic’s insights and articles, consider supporting us with Bitcoin. Your support helps me, as a solo operator, continue delivering high-quality content while managing all the technical aspects, from server maintenance to blog writing, future updates, and improvements. Support Innovation! Thank you.
Bitcoin Address:
bc1qlszw7elx2qahjwvaryh0tkgg8y68enw30gpvge
Please verify this address before sending funds.
Bitcoin QR Code
Simply scan the QR code below to support Techcratic.

Please read the Privacy and Security Disclaimer on how Techcratic handles your support.
Disclaimer: As an Amazon Associate, Techcratic may earn from qualifying purchases.


![Friends: The Complete Series (4K UltraHD) [4K UHD]](https://techcratic.com/wp-content/uploads/2024/11/71zFLJVDUeL._SL1500_-360x180.jpg)


![#UFO FLEET | MUFON CASE # 106156 [MUST SEE] Louisiana](https://techcratic.com/wp-content/uploads/2024/11/1732148641_maxresdefault-360x180.jpg)


