2024-11-05 17:08:00
www.thonking.ai
A while back, Karpathy tweeted that increasing the size of his matmul made it run faster. Surprisingly, it’s not just relatively faster, it takes less absolute time. In other words, despite doing more work, it is executing in less time.
This may seem intuitively quite strange. Is cuBLAS just messing up somehow? Why doesn’t the matrix multiplication kernel just pad it to a larger shape?
It has become tribal knowledge that the particular shapes chosen for matmuls has a surprisingly large effect on their performance. But … why? Can this be understood by mere mortals?
Let’s take a crack at it.
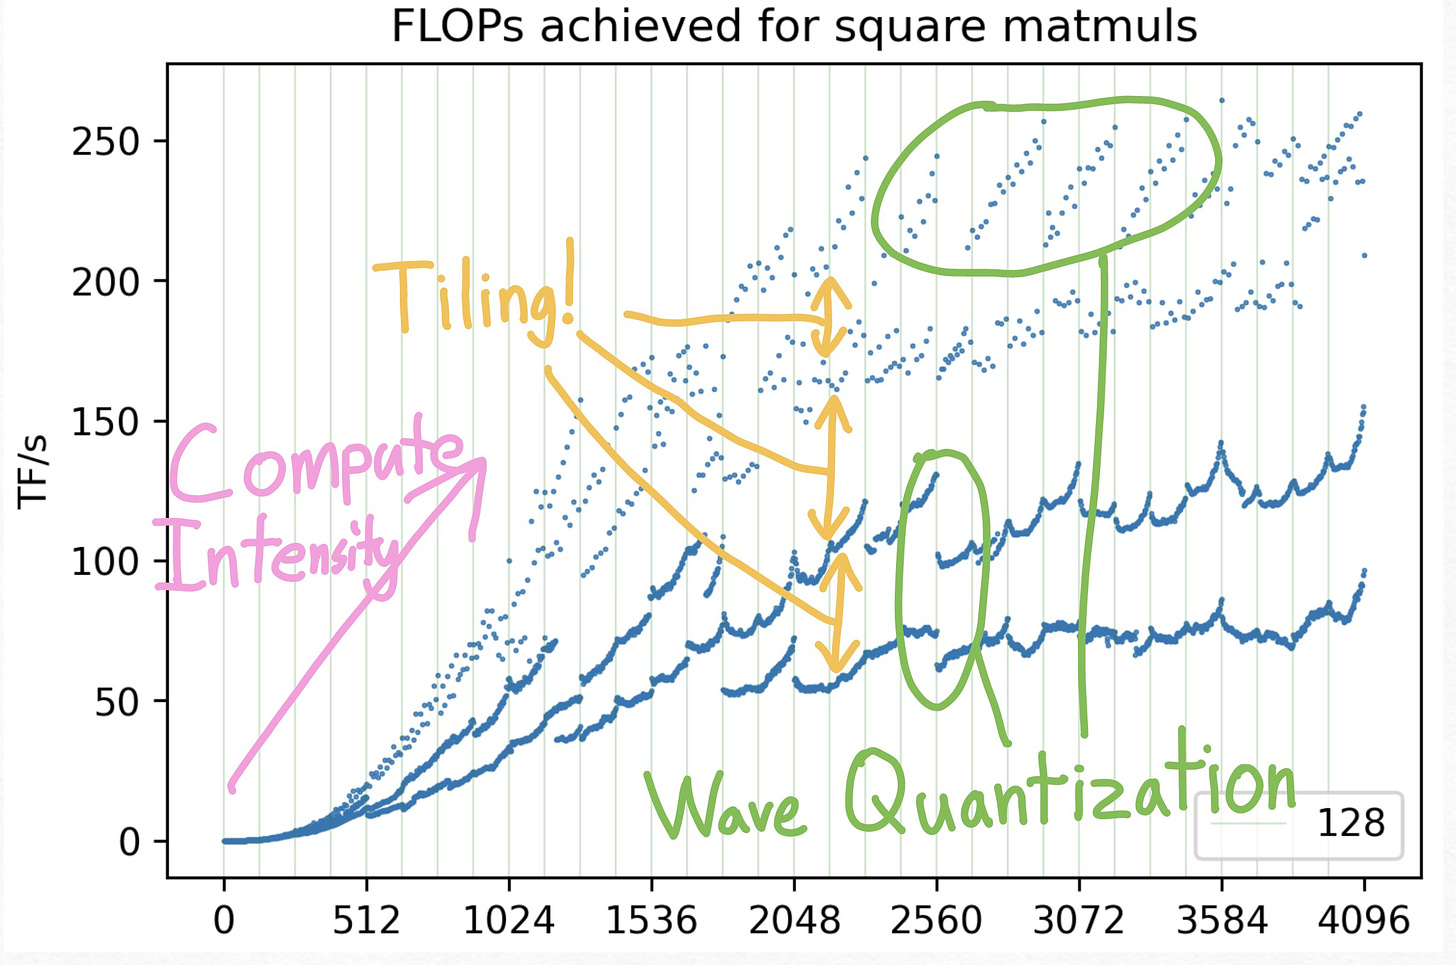
First, let’s plot FLOPs achieved for square matmuls. By the end of this article, I will aim to explain all the strange squiggly lines.
There are 3 general concepts to understand that explain the majority of performance variation among matmul shapes.
-
Compute Intensity/Parallelization: This explains the general upward trend
-
Tiling: This explains the multiple tiers of lines.
-
Wave Quantization: This explains the strange striped lines.
First of all, as we move along the x-axis, the matrix multiplications generally get more performant. There’s two primary reasons for this.
The first one is simply “more work/more parallelism”. There are a large number of fixed overheads that come with launching a kernel (e.g. creating new SMs, waiting for all SMs to finish, etc.), and so, the more work we have to do, the less important those fixed overheads are. Along with more work comes more parallelism, and since GPUs have a ton of parallel cores, you need a surprising amount of work in order to fill a GPU up with enough parallelism.
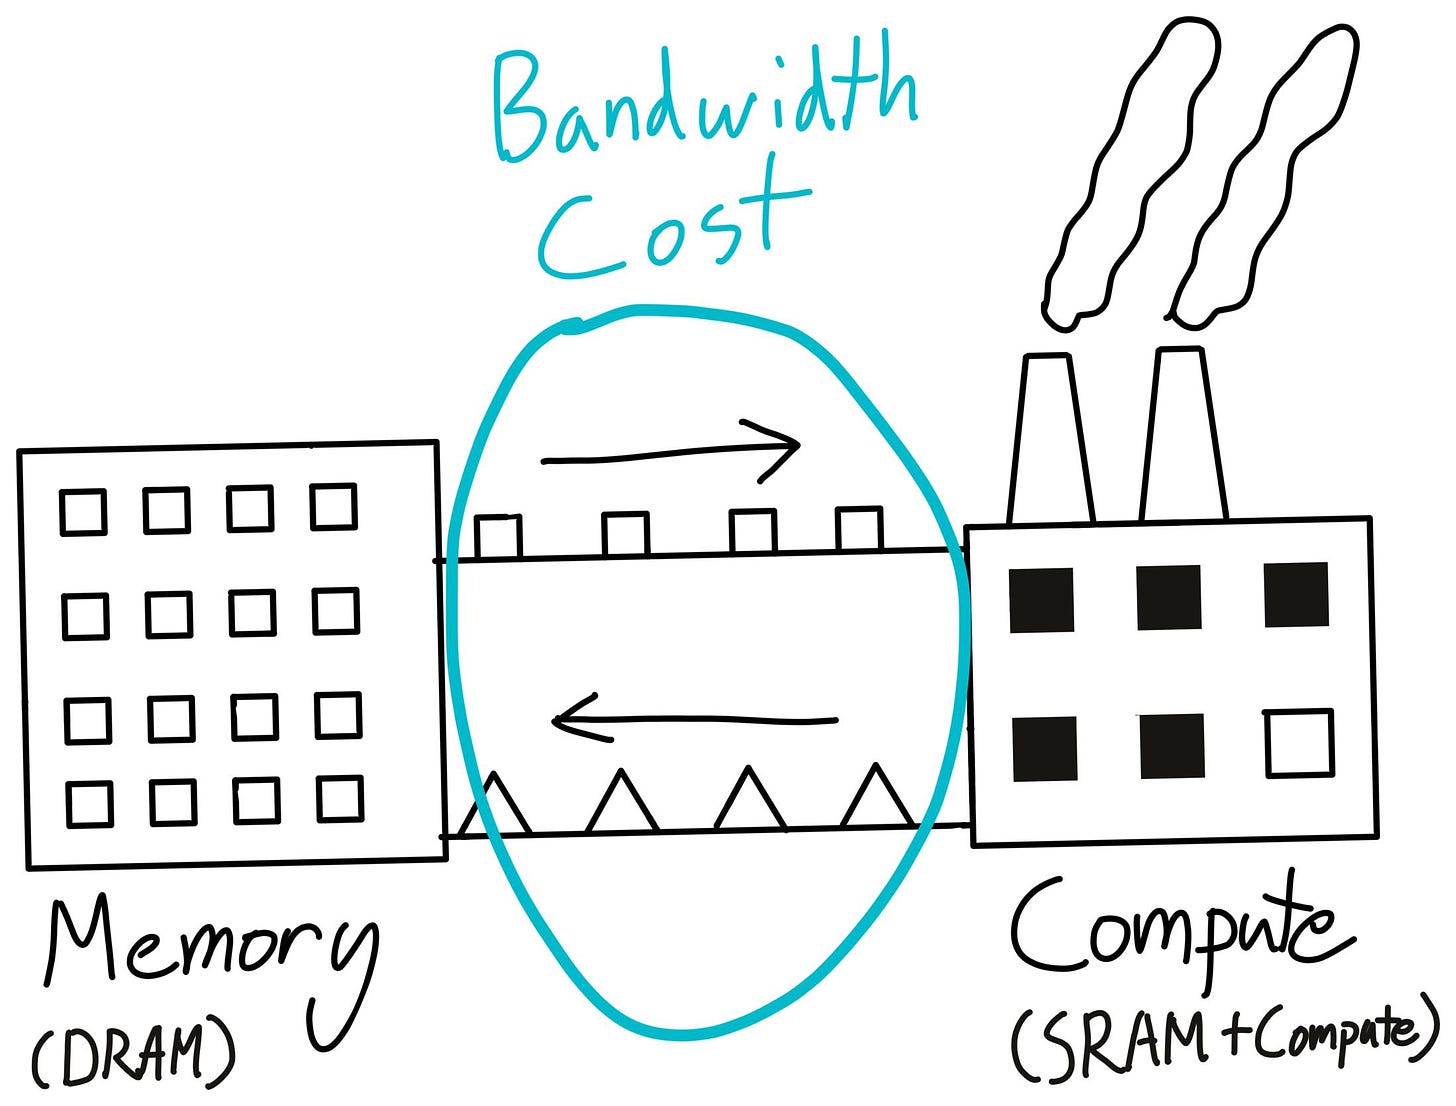
The second one is “arithmetic intensity”. As I’ve written about before, memory accesses are much more expensive than compute. So, since a square matmul performs 3N^2 memory accesses and 2N^3 FLOPs, at a very minimum, N needs to be in the hundreds before we start spending more time on compute than memory!
The desire for sufficient Arithmetic Intensity and Parallelism also compound. For example, let’s say you have your output matrix is 1024 x 1024. If you let each SM compute a 128 x 128 slice of the output, that’s only 64 pieces of “work” for your GPU, not even enough for each one of an A100’s 108 SMs ! If you decrease your output slice size to 64 x 64, we now have 256 pieces of “work” for our GPU, but our arithmetic intensity has also decreased by a factor of 4.
With smaller matrix sizes, you need to worry about problems like this that don’t show up with larger matrices.
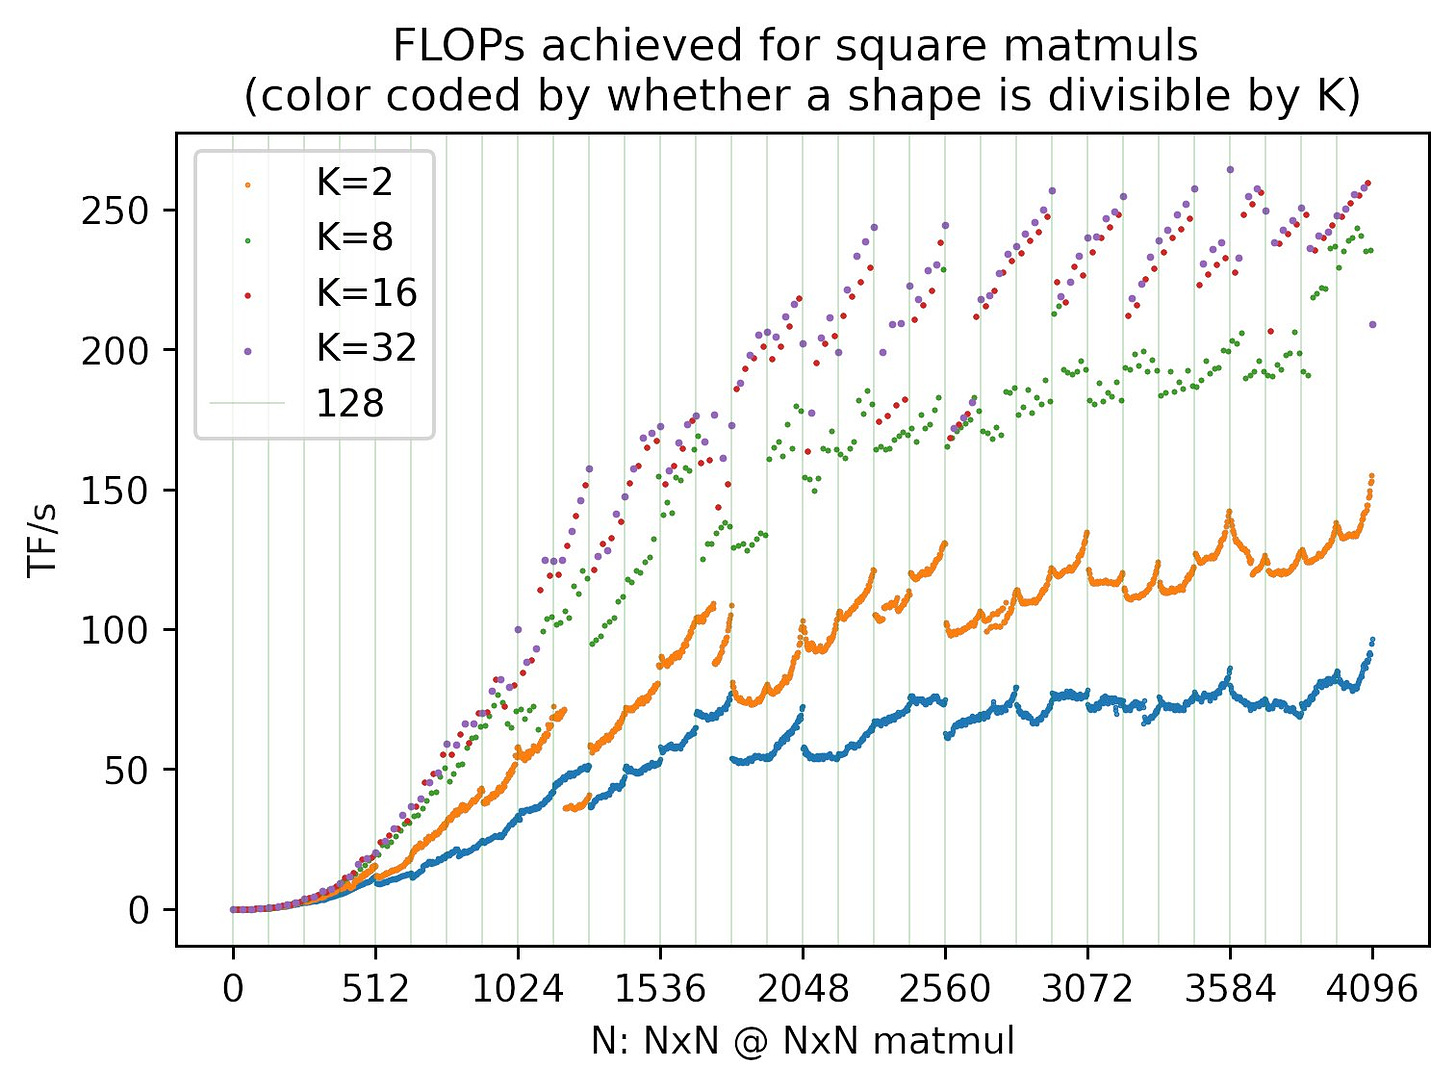
Now that we understand the overall structure of the plot, the next question is: why is the plot all over the place? Why, even for very large matrices, do the TFLOPS jumping between >250 and
To give a hint, let’s color-code each dot by the highest power of 2 it’s divisible by.
As it turns out, the multiple “levels” of FLOPS are due to their shapes’ divisibility. For example, when the shape is odd, the matmul performs significantly worse than when the shape is even. The matmul performs even better when the shape is divisible by 8, with even more performance gains when it’s divisible by 16 or 32.
Now, merely knowing about this effect is very practically useful, but what actually causes this effect? As it turns out, the answer is tiling. But, what even is tiling? And why does it cause such substantial performance issues?

Some online have mentioned tile quantization as the culprit. Tile quantization certainly can impact performance, but only at tile boundary sizes. Basically, tile quantization occurs when the size of your matrix multiplication increases such that the GPU needs to launch another “chunk” of work. For example, imagine that you could multiply 8 elements at a time with a SIMD instruction. Now, if you went from 32 elements to 33 elements (a 3% increase in problem size), you go from needing 4 SIMD instructions to 5 (a 25% increase). Note that crucially, when tile quantization is the culprit, your absolute runtime still grows monotonically, although your efficiency may drop.
However, in our above plot, we see much more drastic performance drops! Moreover, like in Karpathy’s original example, we see that the absolute runtime decreases despite problem size increasing. So, tile quantization cannot be the explanation here.
The true cause is that tiling is just fundamentally worse for certain memory layouts. In other words, by the time we’re trying to execute the matmul, you’ve already lost. The memory layout is poor and your performance will suffer.
Let’s look at some examples!
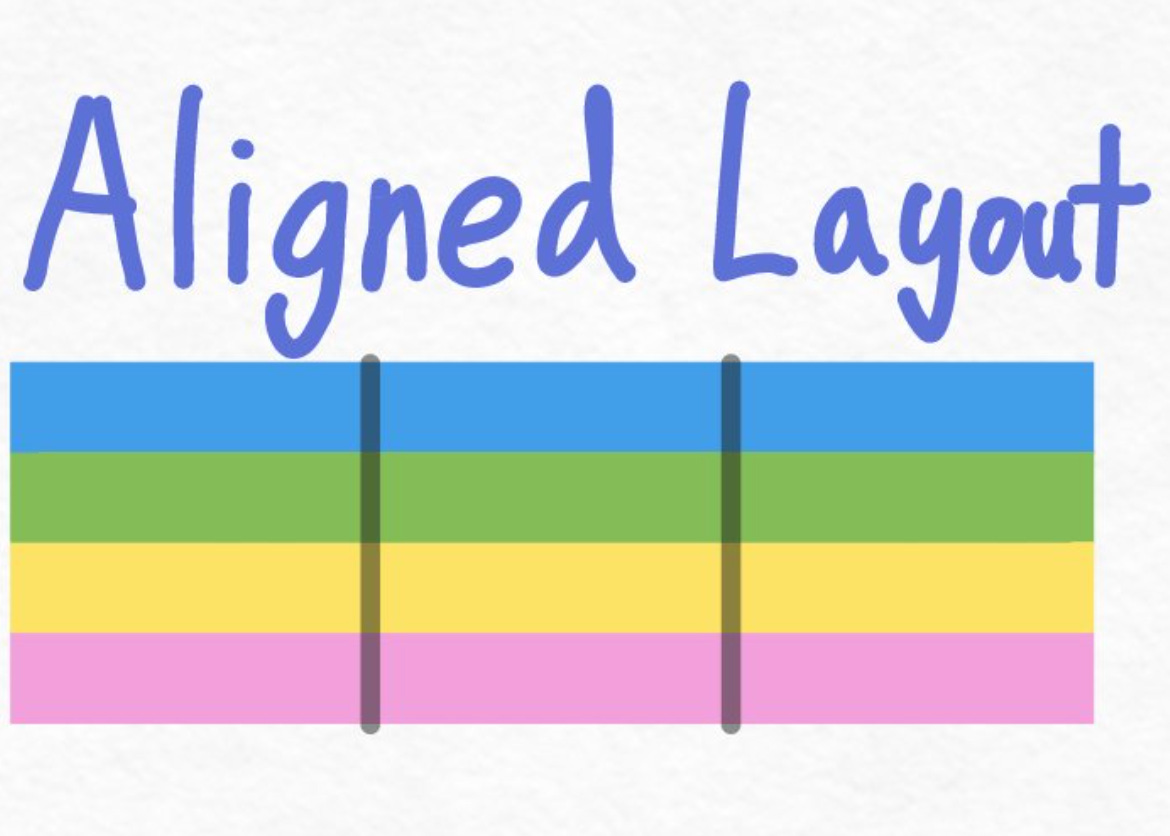
First, let’s think about how our matrix’s memory layout looks like when our size is a multiple of the cache line (pretend it’s 4 elements).
We see that each row starts on a cache line. Among other advantages, this means that we don’t need to perform any “unnecessary” loads to load all yellow elements. We can just load the 3 cache lines that the yellow elements are part of.
However, what happens if we increase the number of elements per row from 12 to 13?
With an unaligned layout, each row is misaligned relative to our cache line. In other words, if we start loading the beginning of the green row, we must redundantly load the last element of the blue row as well.
Now, let’s look at what happens when we actually try to load an entire “tile” from these memory layouts.
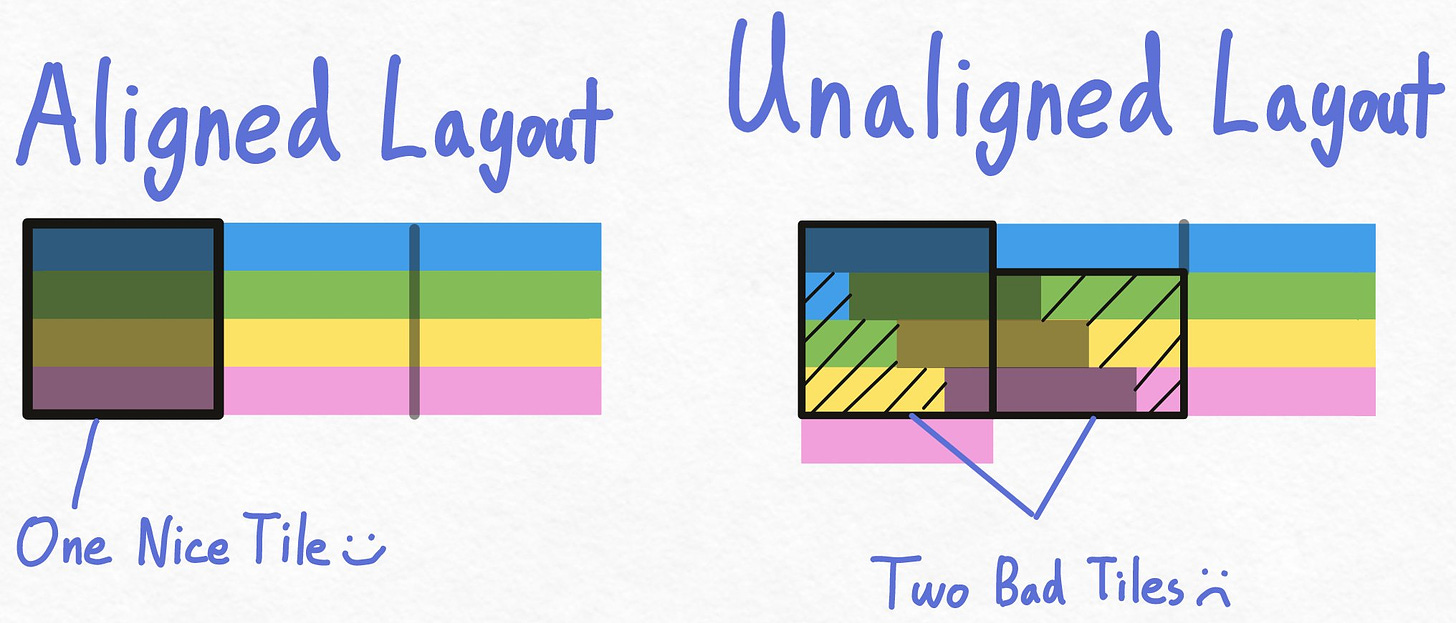
With the aligned layout, this is very clean! We issue one load per row. One for the 4 blue elements, one for the 4 green elements, one for the 4 yellow elements, and one for the 4 pink elements.
With the unaligned layout, things are much messier. For example, in order to load the first 4 green elements, we must issue 2 loads! One that gets the last blue element + the first 3 green elements, and one that gets the 4th green element. A similar pattern occurs with loading the 4 yellow elements as well as the 4 pink elements.
So, when our matrix size is divisible by the cache line (which is 32 elements on a GPU), tiling fits nicely within the cache line, and our memory loads are maximally efficient. When it’s not… the kernel needs many more workarounds in order to end up the proper alignment.
This is why even very small changes in our matrix size can lead to substantially worsened performance.
Ok, so we’ve understood most of the variation in matmul performance. But what about these strange stripes up here? All of these points are with matmuls that are divisible by 32 already. Seeing that the peaks are separated by 256, our first guess might be that this is also memory-layout related, just at a larger scale.
However, as it turns out, these peaks (2944 and 3120) do not occur when the matrix shapes are divisible by 256, but instead they’re at 128 mod 256!
As it turns out, these peaks are not caused by poor memory-layouts, they’re instead caused by a (neatly-named) phenomenon called wave quantization.
The main idea behind wave quantization is quite simple.
Let’s say we have N parallel tasks (which each take a second) and N CPUs.
Q: How long does it perform to take all tasks?
A: 1 second
Q: What about if we have (N+1) parallel tasks, and N CPUs?
A: 2 seconds(!) Now, one CPU must perform two tasks, taking a total of 2 seconds.
So, despite adding just one task, we’ve doubled our overall latency.
This is exactly what wave quantization is, except with CPUs => SMs and tasks => thread blocks.
As your matrix size increases, the total number of tiles/blocks increases. When this crosses a multiple of the # of SMs, your perf drops since you need to execute an additional “wave”.
Now, let’s apply our newfound knowledge to actually explain these curves! Let’s try looking at this sudden drop in performance around 1792 first.
Since wave quantization depends a lot on the actual kernel parameters, we must look at what kernels are actually being run.
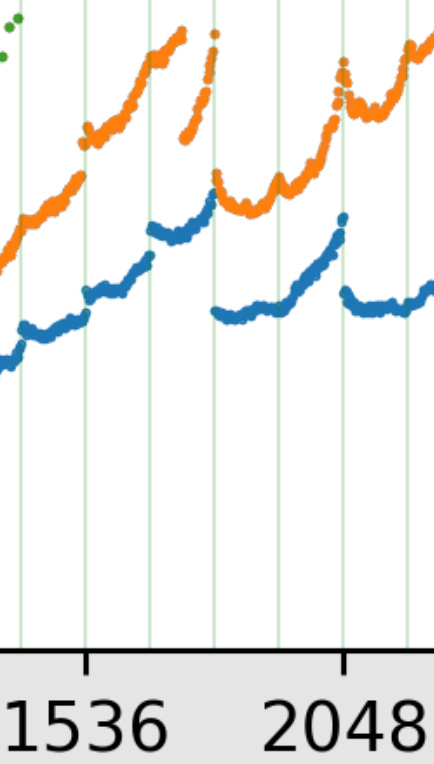
Using the profiler, we see that we’re running a CUTLASS-based matmul with a tile size of 256×128. Note that our matmul kernel *doesn’t change at all*, but our perf drops from 60+ TF/s at N=1791 to 43 TF/s at N=1793.
Now, some basic arithmetic. Our tile grid has dimensions 1792/256 = 7 and 1792/128 = 14. That gives us 7 * 14 = 98 tiles. Since an A100 has 108 SMs, that’s still one wave. However, with N=1793 we need to increase the size of our grid. (7+1)*(14+1) = 120 tiles, or 2 waves!
Now, let’s look at the previous (mysterious) stripes. Specifically, we’ll look at N=3200.
Profiling it, we see that the proximal cause is not actually wave quantization. Instead, CuBLAS decided to change algorithms. But, why did CuBLAS decide to change algorithms?
Well, (3200/128) * (3200/128) = 625. 625/108 = 5.8 waves. Thus, at N=3232 we would create another wave.
In this case, though, it seems that 160×128 still isn’t a great tile size. Since the resulting grid (26×21) results in 5.05 waves…
Well, CuBLAS isn’t perfect!
Beyond the obvious matrix multiplication shape issues, performance loss due to wave quantization often ends up being tricky to find, since it depends upon things like the batch size as well. However, if you take a closer look at each matmul, you might find that there’s another 10-15% performance you can squeeze out of it by choosing the shapes more carefully!
I will note that it’s possible that wave quantization effects may soon be a thing of the past. New matrix multiplication technology like stream-k allow us to completely bypass wave quantization effects. Perhaps I’ll explain the basic idea behind matmul implementation strategies someday.
As it turns out, torch.compile does try and pad your matmuls to have the right shape! See the code here, or try this benchmark.
import torch
torch.set_default_device('cuda')
from triton.testing import do_bench

def f(a, b):
    return torch.mm(a, b)

a = torch.randn(4096, 4096, dtype=torch.bfloat16)
b = torch.randn(4096, 4095, dtype=torch.bfloat16)
print("eager: ", do_bench(lambda: f(a, b)))
cf = torch.compile(f)
print("compiled: ", do_bench(lambda: cf(a, b)))
>> eager: 1.4077268838882446
>> compiled: 0.6021425127983093
However, there are still limitations that mean it makes sense for users to manually pad their shapes.
For one, padding requires a full copy! Although torch.compile can often fuse this into a preceding op, in the case where the matrix being padded comes from the input (like a weight matrix), there’s no way to avoid this copy.
Second, resolving wave quantization is far more difficult.
Overall, I hope the topic of “how do I squeeze the most out of my matmuls” is an interesting one. There’s still many more intricacies in matmul perf that I didn’t have the time to get to, as well (I’m sure) many more intricacies that I don’t know! Here’s the main code to replicate the results.
Also, here’s some quiz questions to test your understanding! I will publish a brief explanation of the answers at some later point.
1: Let’s say I have a [M x K] @ [K x N] matmul. Which one of these configurations will have the best perf? Think about the actual ramifications of tiling! Both matrices are in row-major layout (i.e. K and N are the innermost dimensions)
A: M=2047, K=N=2048
B: K=2047, M=N=2048
C: N=2047, M=K=2048
2: Let’s say I have an A100 with 108 SMs, and I want to benchmark a number of matmuls with no wave quantization. How would I go about constructing the shapes for these matmuls?
3: Based off this post, would you expect that making your batch size a power of 2 leads to more efficient performance?
4: Similar to Question 1, let’s say we have a A: [M x K] @ B: [K x N] matmul. However, now, A is in column-major (i.e. torch.randn(K, M).t()) while B is still row-major. What is the best configuration now?
A: M=2047, K=N=2048
B: K=2047, M=N=2048
C: N=2047, M=K=2048
5: Let’s say that we have this code.
A = torch.randn(4096, 4096)
B = torch.randn(4096, 4096)
B = B[:, :4095] # B now has shape [4096, 4095]
Would you expect that we have good performance on a matmul between A and B?
Solutions can be found below
Support Techcratic
If you find value in Techcratic’s insights and articles, consider supporting us with Bitcoin. Your support helps me, as a solo operator, continue delivering high-quality content while managing all the technical aspects, from server maintenance to blog writing, future updates, and improvements. Support Innovation! Thank you.
Bitcoin Address:
bc1qlszw7elx2qahjwvaryh0tkgg8y68enw30gpvge
Please verify this address before sending funds.
Bitcoin QR Code
Simply scan the QR code below to support Techcratic.

Please read the Privacy and Security Disclaimer on how Techcratic handles your support.
Disclaimer: As an Amazon Associate, Techcratic may earn from qualifying purchases.


![REEVAA 2024 Newest Tesla Model Y Sunshade Roof [No-Sagging, No Gaps] Magnetic-Mid Design…](https://techcratic.com/wp-content/uploads/2024/11/71zM0Ruw8QL._AC_SL1500_-360x180.jpg)


