


![for Tesla Model 3 2025 Dashboard Cover,[Anti-Glare and Dustproof] Suede Dashboard Pad…](https://techcratic.com/wp-content/uploads/2025/08/61yHoBc6VfL._AC_SL1500_-360x180.jpg)


Dorothy Neufeld
2025-02-14 09:05:00
www.visualcapitalist.com
The Bubble Indicator: Is the Stock Market Overheating?
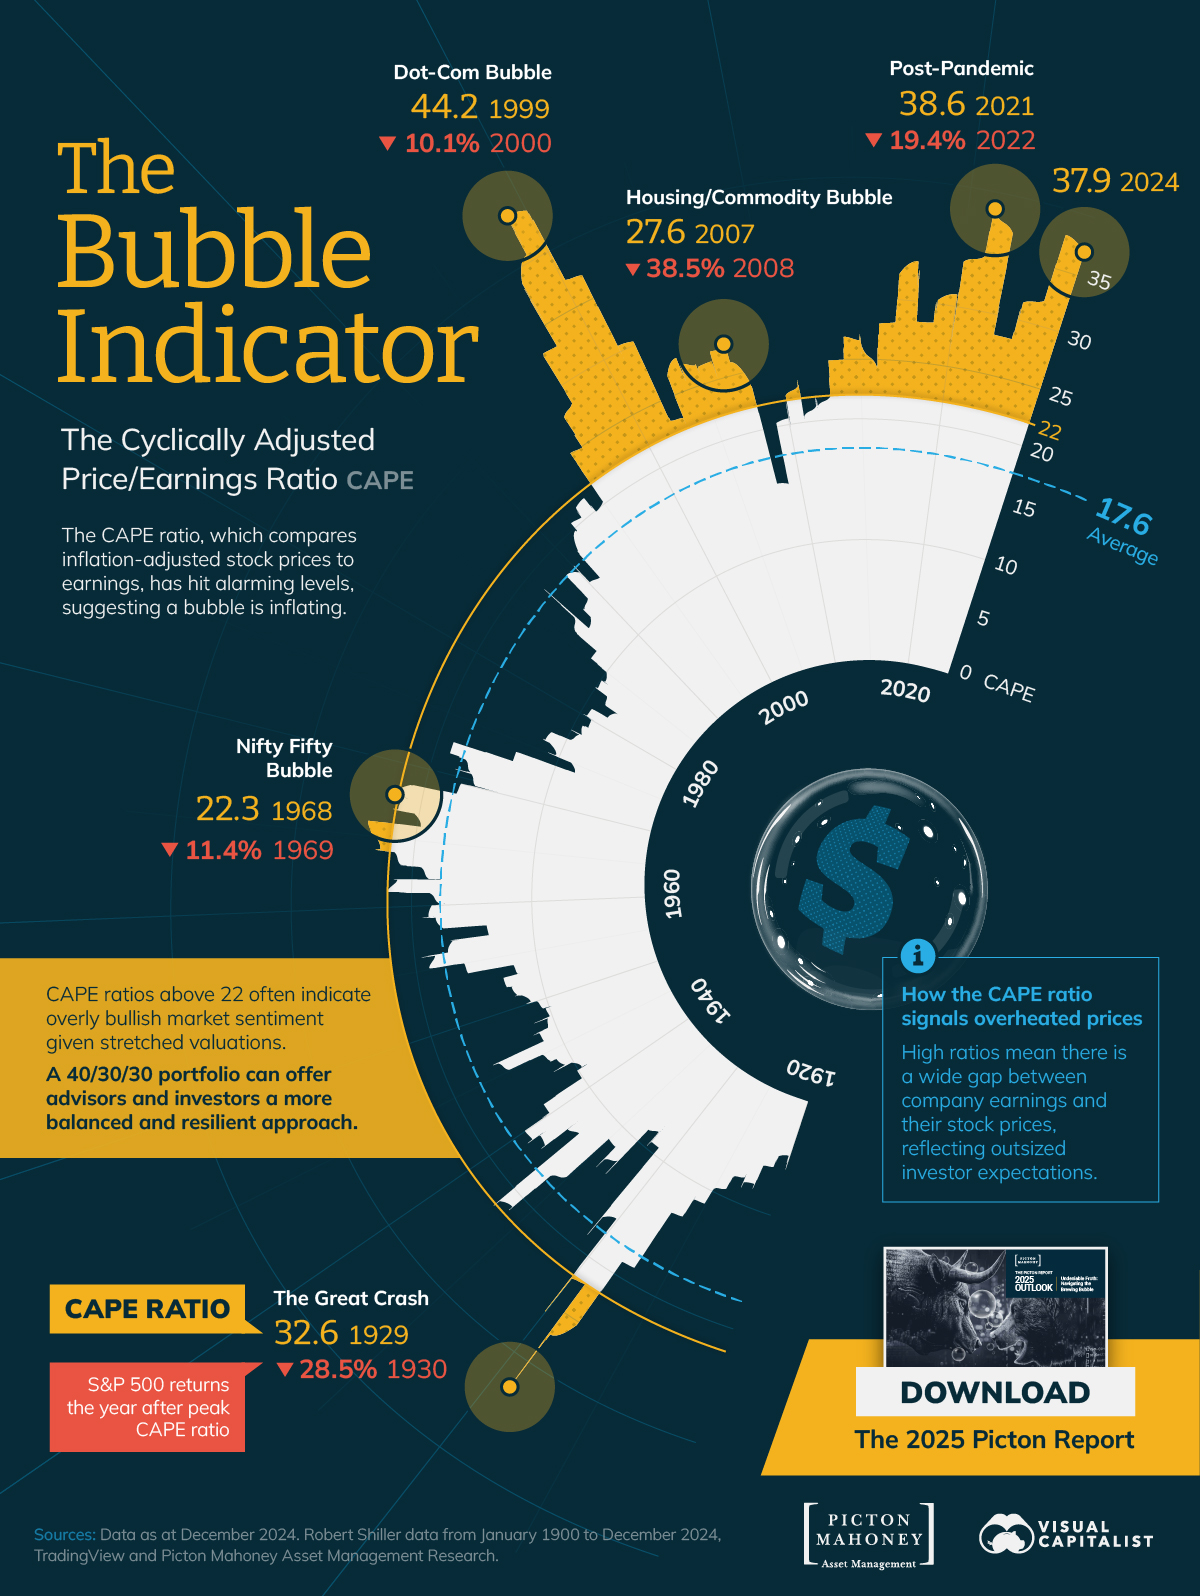
Today, the S&P 500’s cyclically adjusted price-to-earnings ratio (CAPE) is nearing historic highs, signaling market valuations may be in overheated territory.
In December 2024, the S&P 500 CAPE ratio stood at 37.9—well above its long-term average of 17.6. Notably, it has only exceeded this level during the Dot-Com bubble and in 2021.
This graphic from Picton Mahoney Asset Management shows the S&P 500 CAPE ratio since 1920.
The S&P 500 CAPE Ratio Across Major Bubbles
The CAPE ratio is a widely used metric for assessing stock market valuations, comparing equity prices to their 10-year average earnings.
By smoothing out short-term fluctuations, it accounts for economic cycles and offers a more stable view of long-term value. Higher CAPE levels often signal stretched valuations, with historical trends showing that ratios above 22 typically indicate heightened market optimism.
Here are the peak CAPE ratios during major market bubbles over the past century:
| Name | Peak S&P 500 CAPE Ratio |
Peak Date | S&P 500 Returns the Year After |
|---|---|---|---|
| Post-Pandemic | 38.6 | Nov 2021 | -19.4% |
| Housing/Commodity Bubble | 27.6 | May 2007 | -38.5% |
| Dot-Com Bubble | 44.2 | Dec 1999 | -10.1% |
| Nifty Fifty Bubble | 22.3 | Dec 1968 | -11.4% |
| The Great Crash | 32.6 | Sep 1929 | -28.5% |
Sources: Data as at December 2024. Robert Shiller data from January 1920 to December 2024. TradingView and Picton Mahoney Asset Management Research.
The CAPE ratio hit an all-time high during the Dot-Com bubble in 1999, which was followed by a 40% decline in the S&P 500 from 2000 to 2002.
More recently, the ratio climbed to 38.6 in 2021, its second-highest reading ever, fueled by massive pandemic stimulus and a big tech rally. The following year, the S&P 500 sank 19.4% as the Federal Reserve kicked off its monetary tightening cycle.
Similarly, the CAPE ratio has risen sharply as AI enthusiasm—particularly for Magnificent Seven stocks—has led stock prices to soar, making stock prices expensive by historical standards.
Diversification Strategies for Market Bubbles
At a time of outsized investor expectations, a more balanced portfolio allocation may reduce exposure to market bubble risk.
Investors and advisors can implement Picton Mahoney Asset Management’s Innovative Portfolio, which offers a strategic 40/30/30 mix of equities, bonds, and alternatives to hedge against a potential asset bubble.
Download The 2025 Picton Report.
var disqus_shortname = “visualcapitalist.disqus.com”;
var disqus_title = “The Bubble Indicator: Is the Stock Market Overheating?”;
var disqus_url = “https://www.visualcapitalist.com/sp/the-bubble-indicator-is-the-stock-market-overheating/”;
var disqus_identifier = “visualcapitalist.disqus.com-174780”;
-
 Markets20 hours ago
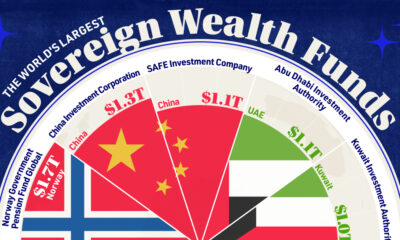
Rank: The Largest Sovereign Wealth Funds in the World
In this graphic, we show the top 10 sovereign wealth funds globally, holding a combined $9.6 trillion in assets.
-

 Markets23 hours ago
Ranked: Automakers by U.S. Market Share
The U.S. auto industry remains highly competitive, with a diverse mix of domestic and international brands vying for market share.
-
 Mining3 days ago
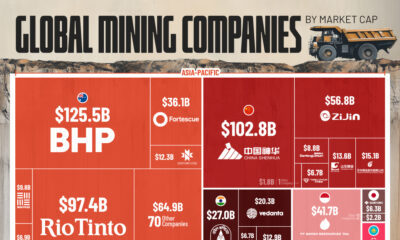
Charted: The Global Mining Industry, by Market Cap
Australia tops the list, with its major mining companies totaling $353 billion in market cap.
-

 Money3 days ago
How the U.S. Dollar Has Performed, by President (1967-2025)
We show the performance of the U.S. Dollar Index under every president since 1967, from its record highs in 1985 to its all-time lows in 2008.
-
 Markets4 days ago
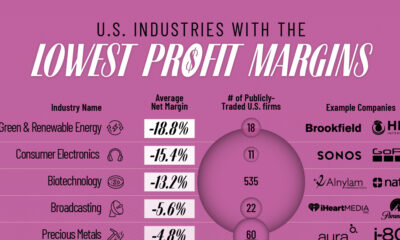
Ranked: U.S. Industries Where Companies Are Least Profitable
A snapshot of which sectors are the least profitable, based on the latest data. Spoiler: Big Pharma makes this list.
-
 Markets1 week ago
Ranked: U.S. Industries Where Companies Make the Most Profit
A snapshot of which sectors earn the most profit, based on the latest data. Spoiler: #1 is not Big Tech.
The post The Bubble Indicator: Is the Stock Market Overheating? appeared first on Visual Capitalist.

Keep your files stored safely and securely with the SanDisk 2TB Extreme Portable SSD. With over 69,505 ratings and an impressive 4.6 out of 5 stars, this product has been purchased over 8K+ times in the past month. At only $129.99, this Amazon’s Choice product is a must-have for secure file storage.
Help keep private content private with the included password protection featuring 256-bit AES hardware encryption. Order now for just $129.99 on Amazon!
Help Power Techcratic’s Future – Scan To Support
If Techcratic’s content and insights have helped you, consider giving back by supporting the platform with crypto. Every contribution makes a difference, whether it’s for high-quality content, server maintenance, or future updates. Techcratic is constantly evolving, and your support helps drive that progress.
As a solo operator who wears all the hats, creating content, managing the tech, and running the site, your support allows me to stay focused on delivering valuable resources. Your support keeps everything running smoothly and enables me to continue creating the content you love. I’m deeply grateful for your support, it truly means the world to me! Thank you!
|
BITCOIN
bc1qlszw7elx2qahjwvaryh0tkgg8y68enw30gpvge Scan the QR code with your crypto wallet app |
|
DOGECOIN
D64GwvvYQxFXYyan3oQCrmWfidf6T3JpBA Scan the QR code with your crypto wallet app |
|
ETHEREUM
0xe9BC980DF3d985730dA827996B43E4A62CCBAA7a Scan the QR code with your crypto wallet app |


Please read the Privacy and Security Disclaimer on how Techcratic handles your support.
Disclaimer: As an Amazon Associate, Techcratic may earn from qualifying purchases.


