


![for Tesla Model 3 2025 Dashboard Cover,[Anti-Glare and Dustproof] Suede Dashboard Pad…](https://techcratic.com/wp-content/uploads/2025/08/61yHoBc6VfL._AC_SL1500_-360x180.jpg)


Kayla Zhu
2025-02-28 10:43:00
www.visualcapitalist.com
Average Weekly Hours Worked by U.S. Employees
This was originally posted on our Voronoi app. Download the app for free on iOS or Android and discover incredible data-driven charts from a variety of trusted sources.
Average weekly working hours typically see a decline during recessions, as employers seek to cut payroll costs during these periods by reducing hours.
However, in recent years, weekly hours have seen a consistent decline despite the U.S. being outside of a recession.
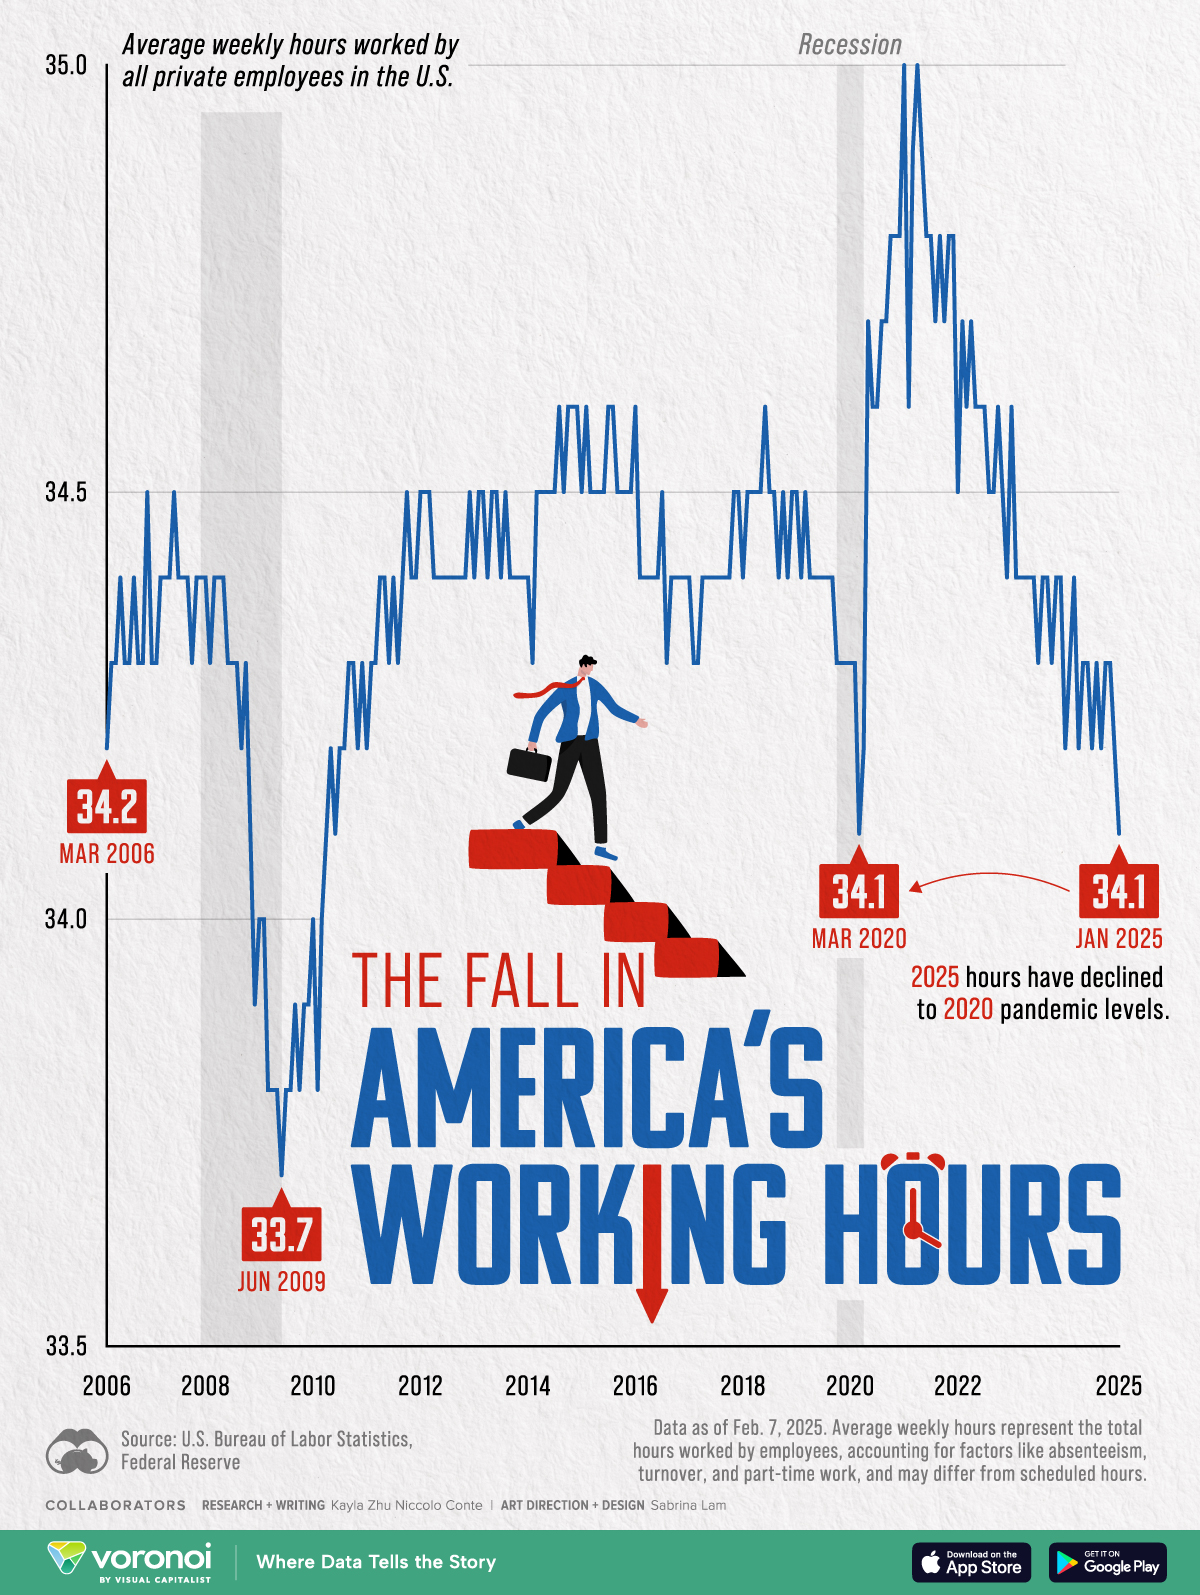
This graphic visualizes the average weekly hours worked by all private employees in the U.S.
The data comes from the U.S. Bureau of Labor Statistics (BLS) via the Federal Reserve and is updated as of Feb. 7, 2025.
Average weekly hours represent the total hours worked by employees for which pay was received, accounting for factors like unpaid absenteeism, turnover, and part-time work, and may differ from scheduled hours.
Average Weekly Hours Worked Are On the Decline
Below, we show the average weekly hours worked for all U.S. private employees from 2006 to early 2025.
| Date | Average weekly hours worked for all U.S. private employees |
|---|---|
| 2006-03-01 | 34.2 |
| 2006-09-01 | 34.4 |
| 2007-03-01 | 34.4 |
| 2007-09-01 | 34.4 |
| 2008-03-01 | 34.4 |
| 2008-09-01 | 34.2 |
| 2009-03-01 | 33.8 |
| 2009-09-01 | 33.9 |
| 2010-03-01 | 34 |
| 2010-09-01 | 34.3 |
| 2011-03-01 | 34.3 |
| 2011-09-01 | 34.4 |
| 2012-03-01 | 34.5 |
| 2012-09-01 | 34.4 |
| 2013-03-01 | 34.5 |
| 2013-09-01 | 34.4 |
| 2014-03-01 | 34.5 |
| 2014-09-01 | 34.5 |
| 2015-03-01 | 34.5 |
| 2015-09-01 | 34.5 |
| 2016-03-01 | 34.4 |
| 2016-09-01 | 34.4 |
| 2017-03-01 | 34.3 |
| 2017-09-01 | 34.4 |
| 2018-03-01 | 34.5 |
| 2018-09-01 | 34.4 |
| 2019-03-01 | 34.5 |
| 2019-09-01 | 34.4 |
| 2020-03-01 | 34.1 |
| 2020-09-01 | 34.7 |
| 2021-03-01 | 34.9 |
| 2021-09-01 | 34.8 |
| 2022-03-01 | 34.6 |
| 2022-09-01 | 34.5 |
| 2023-03-01 | 34.4 |
| 2023-09-01 | 34.4 |
| 2024-03-01 | 34.4 |
| 2024-09-01 | 34.2 |
| 2025-01-01 | 34.1 |
The average number of weekly hours worked in the U.S. in 2025 has dropped to levels seen during the 2020 pandemic, signaling potential weakness in labor demand.
This decline follows a steady decrease from a peak in 2021.
Sectors Driving the Trend
The BLS attributes this decline to reductions in the retail trade and leisure and hospitality industries, which have faced weaker demand, influenced by shifting consumer behavior post-pandemic, including a decline in in-person shopping and dining.
Despite employment gains since the pandemic low, both these sectors remain below or barely above pre-2020 employment levels, signaling ongoing weakness.
Both these sectors also have trended towards hiring more part-time employees, further contributing to lower weekly hours.
However, the BLS noted that while retail trade and leisure and hospitality saw the greatest recent declines in average weekly hours worked, there has been a broader trend toward slightly reduced average weekly hours across most industries in the United States.
The number of hours worked typically declines during recessions, as seen in both the Great Recession (2008–2009) and the COVID-19 recession (2020). However, the decline during the pandemic was more abrupt and short-lived.
Learn More on the Voronoi App 
To compare average working hours across the world, check out this graphic that visualizes the average weekly number of hours worked per employee by country.
The post Visualizing the Average American Work Week (2006-2025) appeared first on Visual Capitalist.

Keep your files stored safely and securely with the SanDisk 2TB Extreme Portable SSD. With over 69,505 ratings and an impressive 4.6 out of 5 stars, this product has been purchased over 8K+ times in the past month. At only $129.99, this Amazon’s Choice product is a must-have for secure file storage.
Help keep private content private with the included password protection featuring 256-bit AES hardware encryption. Order now for just $129.99 on Amazon!
Help Power Techcratic’s Future – Scan To Support
If Techcratic’s content and insights have helped you, consider giving back by supporting the platform with crypto. Every contribution makes a difference, whether it’s for high-quality content, server maintenance, or future updates. Techcratic is constantly evolving, and your support helps drive that progress.
As a solo operator who wears all the hats, creating content, managing the tech, and running the site, your support allows me to stay focused on delivering valuable resources. Your support keeps everything running smoothly and enables me to continue creating the content you love. I’m deeply grateful for your support, it truly means the world to me! Thank you!
|
BITCOIN
bc1qlszw7elx2qahjwvaryh0tkgg8y68enw30gpvge Scan the QR code with your crypto wallet app |
|
DOGECOIN
D64GwvvYQxFXYyan3oQCrmWfidf6T3JpBA Scan the QR code with your crypto wallet app |
|
ETHEREUM
0xe9BC980DF3d985730dA827996B43E4A62CCBAA7a Scan the QR code with your crypto wallet app |


Please read the Privacy and Security Disclaimer on how Techcratic handles your support.
Disclaimer: As an Amazon Associate, Techcratic may earn from qualifying purchases.


