


![for Tesla Model 3 2025 Dashboard Cover,[Anti-Glare and Dustproof] Suede Dashboard Pad…](https://techcratic.com/wp-content/uploads/2025/08/61yHoBc6VfL._AC_SL1500_-360x180.jpg)


Kayla Zhu
2025-03-06 08:09:00
www.visualcapitalist.com
Disposable Income Growth of G7 Countries from 2007-2024
This was originally posted on our Voronoi app. Download the app for free on iOS or Android and discover incredible data-driven charts from a variety of trusted sources.
Household disposable income, a key economic marker of financial well-being and consumer purchasing power, has mostly risen across most G7 countries since 2007, but the pace of growth varies significantly.
Even amongst some of the world’s most advanced economies, some countries have struggled to keep up due to slow wage growth or prolonged economic stagnation.
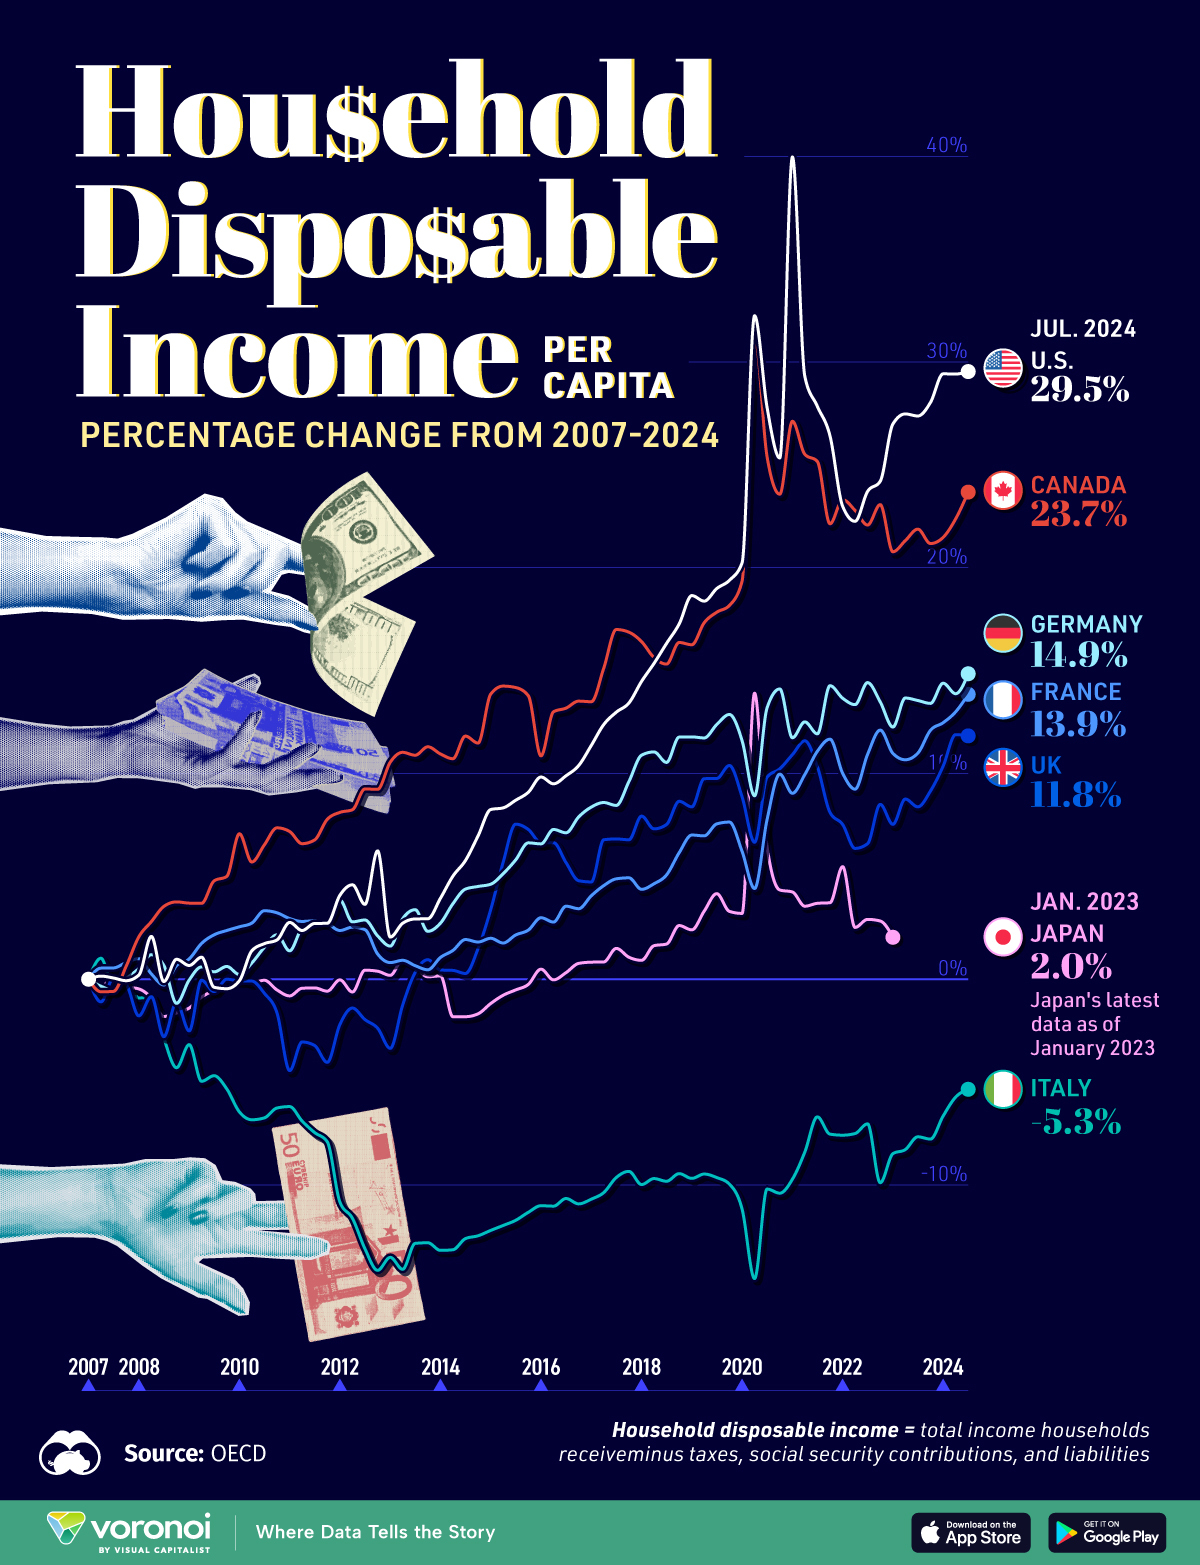
This graphic shows the percent change in household disposable income per capita for each G7 country from 2007 to July 2024.
The data comes from the OECD, and Japan’s latest data is for January 2023.
Household disposable income is defined as the a household’s total income minus taxes, social security contributions, and liabilities. Figures are inflation-adjusted.
G7 Growth in Household Disposable Income Per Capita
Below, we show the change in household disposable income per capita from 2007 for each G7 country.
| Year |  (% change) (% change) |
 (% change) (% change) |
 (% change) (% change) |
 (% change) (% change) |
 (% change) (% change) |
 (% change) (% change) |
 (% change) (% change) |
|---|---|---|---|---|---|---|---|
| 2007 (base) | 0.0 | 0.0 | 0.0 | 0.0 | 0.0 | 0.0 | 0.0 |
| 2008 | 0.5 | -0.9 | 1.0 | 2.1 | -0.5 | 0.2 | -1.8 |
| 2009 | 0.0 | -3.2 | 1.0 | 3.7 | -1.4 | 0.7 | -2.5 |
| 2010 | 0.2 | -6.5 | 2.6 | 7.1 | 0.1 | -0.1 | -0.1 |
| 2011 | 1.4 | -6.2 | 3.0 | 7.2 | -0.8 | 2.8 | -4.4 |
| 2012 | 3.8 | -10.8 | 2.4 | 8.1 | 0.0 | 4.1 | -2.2 |
| 2013 | 1.6 | -13.5 | 0.8 | 10.6 | 0.2 | 2.1 | -3.4 |
| 2014 | 2.7 | -13.2 | 1.1 | 11.0 | 0.2 | 3.9 | 0.5 |
| 2015 | 4.6 | -12.2 | 2.0 | 13.9 | -1.2 | 8.3 | 3.4 |
| 2016 | 6.6 | -11.0 | 3.0 | 10.9 | 0.5 | 9.8 | 6.6 |
| 2017 | 8.4 | -10.7 | 4.1 | 13.5 | 0.8 | 11.4 | 4.7 |
| 2018 | 10.9 | -10.0 | 4.4 | 16.4 | 0.9 | 14.5 | 7.9 |
| 2019 | 11.8 | -9.7 | 7.0 | 16.3 | 2.4 | 18.7 | 8.4 |
| 2020 | 11.6 | -11.2 | 6.2 | 19.4 | 3.2 | 20.2 | 8.9 |
| 2021 | 11.7 | -9.7 | 9.0 | 27.1 | 4.2 | 40.0 | 10.9 |
| 2022 | 13.7 | -7.6 | 10.0 | 23.3 | 5.5 | 23.0 | 7.5 |
| 2023 | 12.3 | -8.5 | 11.0 | 20.8 | 2.0 | 27.0 | 7.5 |
| January 2024 | 14.4 | -6.7 | 12.5 | 21.5 | 29.4 | 10.4 | |
| July 2024 | 14.9 | -5.3 | 13.9 | 23.7 | 29.5 | 11.8 |
The U.S. and Canada saw the highest increases in average household disposable incomes from 2007 to 2024, rising by 29.5% and 23.7%, respectively—far outpacing the rest of their G7 counterparts.
The U.S. saw particularly strong growth in 2021, when disposable income surged 40% due to federal stimulus payments, expanded social benefits, and wage growth from post-pandemic job recovery.
Among the European G7 countries, Germany (14.9%), France (13.9%), and the UK (11.8%) experienced steady but more modest gains in disposable income over this period.
Japan recorded a minimal increase of 2.0% as of its latest available data in January 2023.
Italy stands out as the only G7 country where household disposable income has declined (-5.3%) since 2007, reflecting prolonged economic stagnation that have hampered income growth.
Learn More on the Voronoi App 
To check out more comparisons of G7 countries, check out this graphic that visualizes the GDP per capita of G7 countries with the richest and poorest U.S. states.
The post Charted: Disposable Income Growth of G7 Countries (2007-2024) appeared first on Visual Capitalist.

Keep your files stored safely and securely with the SanDisk 2TB Extreme Portable SSD. With over 69,505 ratings and an impressive 4.6 out of 5 stars, this product has been purchased over 8K+ times in the past month. At only $129.99, this Amazon’s Choice product is a must-have for secure file storage.
Help keep private content private with the included password protection featuring 256-bit AES hardware encryption. Order now for just $129.99 on Amazon!
Help Power Techcratic’s Future – Scan To Support
If Techcratic’s content and insights have helped you, consider giving back by supporting the platform with crypto. Every contribution makes a difference, whether it’s for high-quality content, server maintenance, or future updates. Techcratic is constantly evolving, and your support helps drive that progress.
As a solo operator who wears all the hats, creating content, managing the tech, and running the site, your support allows me to stay focused on delivering valuable resources. Your support keeps everything running smoothly and enables me to continue creating the content you love. I’m deeply grateful for your support, it truly means the world to me! Thank you!
|
BITCOIN
bc1qlszw7elx2qahjwvaryh0tkgg8y68enw30gpvge Scan the QR code with your crypto wallet app |
|
DOGECOIN
D64GwvvYQxFXYyan3oQCrmWfidf6T3JpBA Scan the QR code with your crypto wallet app |
|
ETHEREUM
0xe9BC980DF3d985730dA827996B43E4A62CCBAA7a Scan the QR code with your crypto wallet app |


Please read the Privacy and Security Disclaimer on how Techcratic handles your support.
Disclaimer: As an Amazon Associate, Techcratic may earn from qualifying purchases.


