


![[Download] Intuitive 3D Modeling | Abstract Sculpture | FLIGHT | DANA KRYSTLE](https://techcratic.com/wp-content/uploads/2025/08/1755630966_maxresdefault-360x180.jpg)


![for Tesla Model 3 2025 Dashboard Cover,[Anti-Glare and Dustproof] Suede Dashboard Pad…](https://techcratic.com/wp-content/uploads/2025/08/61yHoBc6VfL._AC_SL1500_-360x180.jpg)


Jeff Desjardins
2025-03-18 12:12:00
www.visualcapitalist.com
![]() See this visualization first on the Voronoi app.
See this visualization first on the Voronoi app.
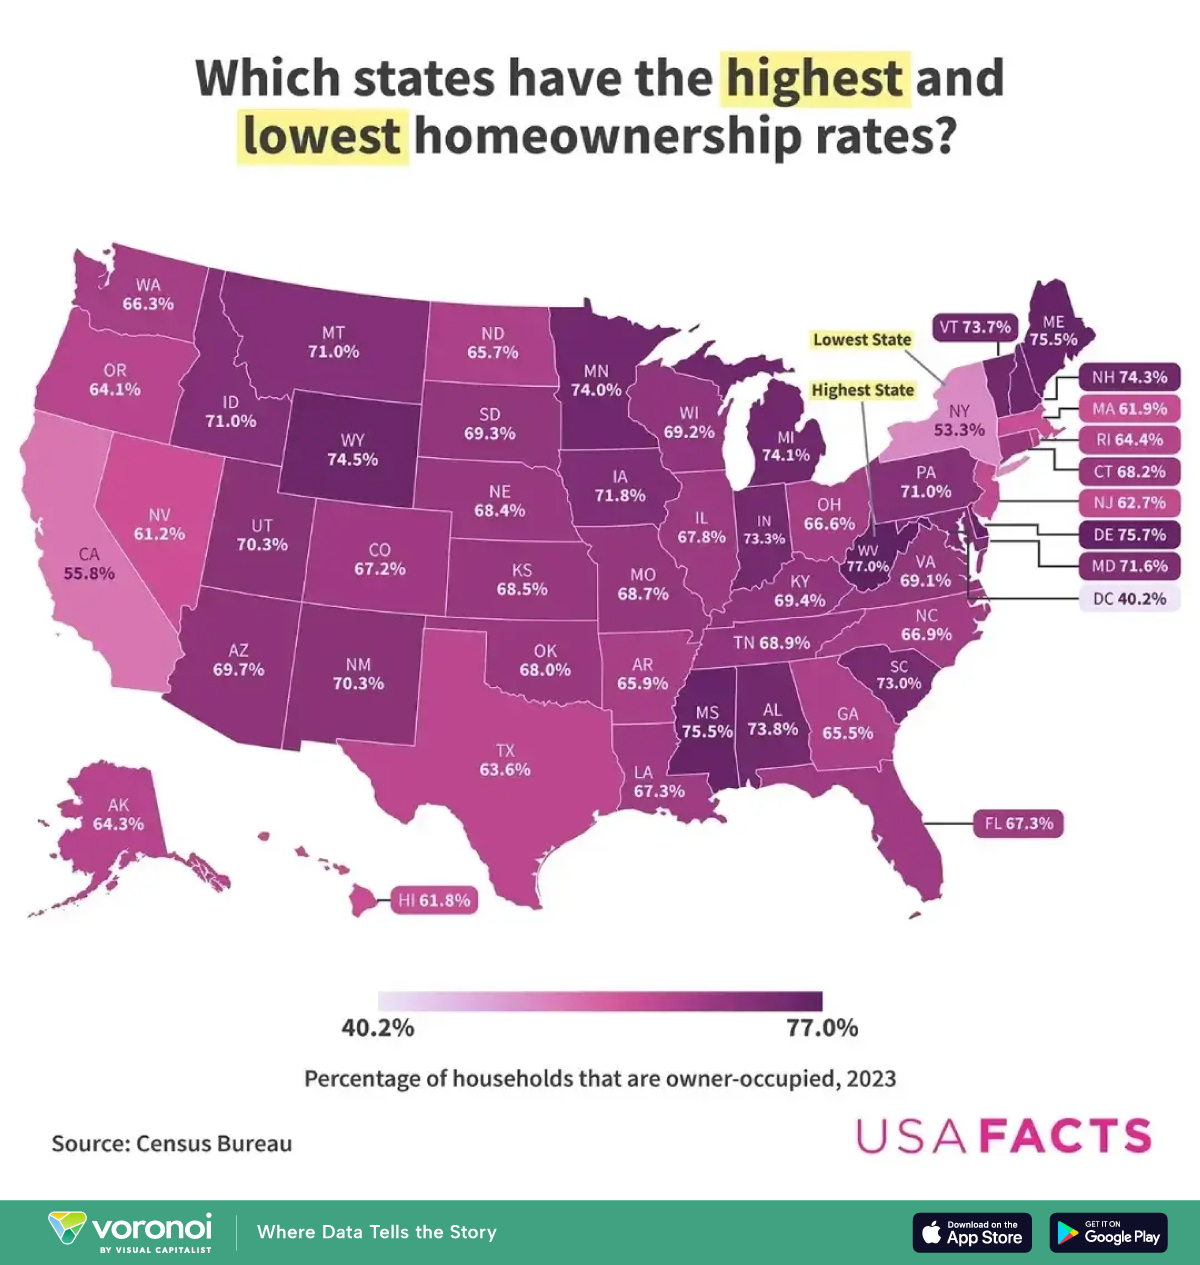
U.S. States By Home Ownership Rates
This was originally posted on our Voronoi app. Download the app for free on iOS or Android and discover incredible data-driven charts from a variety of trusted sources.
As of 2024, nearly two-thirds (65.7%) U.S. households owned their home, while the rest rented.
However, homeownership rates vary widely across states and between urban, suburban, and rural areas, reflecting differences in affordability, housing availability, and local economic conditions.
This map by USAFacts visualizes the share of households that are owner-occupied by state in 2023.
Data comes from the Census Bureau’s Housing Vacancies and Homeownership portion of the Current Population Survey.
Which State Has the Highest Home Ownership Rate?
Below, we show home ownership rates by state in 2023.
| State/Area | Share of households that are owner-occupied (2023) |
|---|---|
| West Virginia | 77.0% |
| Delaware | 75.7% |
| Mississippi | 75.5% |
| Maine | 75.5% |
| Wyoming | 74.5% |
| New Hampshire | 74.3% |
| Michigan | 74.1% |
| Minnesota | 74.0% |
| Alabama | 73.8% |
| Vermont | 73.7% |
| Indiana | 73.3% |
| South Carolina | 73.0% |
| Iowa | 71.8% |
| Maryland | 71.6% |
| Montana | 71.0% |
| Idaho | 71.0% |
| Pennsylvania | 71.0% |
| Utah | 70.3% |
| New Mexico | 70.3% |
| Arizona | 69.7% |
| South Dakota | 69.3% |
| Wisconsin | 69.2% |
| Virginia | 69.1% |
| Tennessee | 68.9% |
| Missouri | 68.7% |
| Kansas | 68.5% |
| Nebraska | 68.4% |
| Kentucky | 68.4% |
| Connecticut | 68.2% |
| Oklahoma | 68.0% |
| Illinois | 67.8% |
| Louisiana | 67.3% |
| Florida | 67.3% |
| Colorado | 67.2% |
| North Carolina | 66.9% |
| Ohio | 66.6% |
| Washington | 66.3% |
| Arkansas | 65.9% |
| North Dakota | 65.7% |
| Georgia | 65.5% |
| Rhode Island | 64.4% |
| Alaska | 64.3% |
| Oregon | 64.10% |
| Texas | 63.6% |
| New Jersey | 62.7% |
| Massachusetts | 61.9% |
| Hawaii | 61.8% |
| Nevada | 61.2% |
| California | 55.8% |
| New York | 53.3% |
| District of Columbia | 40.2% |
West Virginia had the highest homeownership rate in 2023, with 77% of households owning their homes.
One key factor behind West Virginia’s high ownership rate is its relative affordability. The state consistently ranks among those with the lowest median home sale prices, and it has the lowest home price-to-income ratio in the country.
Additionally, the state’s largely rural landscape and lower population density may contribute to its high homeownership rate, as housing availability is less constrained than in densely populated urban markets.
In contrast, states with the lowest homeownership rates such as Hawaii, California, and New York, also have some of the highest home prices and home price-to-income ratios, making ownership less attainable.
Places like New York and Calfornia also face high demand in urban centers, a greater share of renters due to job concentration and lifestyle preferences, and tend to have stricter zoning regulations.
This pattern highlights that while affordability plays a significant role, homeownership rates are also influenced by factors like housing supply, economic opportunities, and regional job markets.
Learn More on the Voronoi App 
Learn more about U.S. real estate in this this graphic, which visualizes the annual nominal change in house prices by state as of the first quarter of 2024.
The post Mapped: Homeownership Rates by U.S. State appeared first on Visual Capitalist.

Keep your files stored safely and securely with the SanDisk 2TB Extreme Portable SSD. With over 69,505 ratings and an impressive 4.6 out of 5 stars, this product has been purchased over 8K+ times in the past month. At only $129.99, this Amazon’s Choice product is a must-have for secure file storage.
Help keep private content private with the included password protection featuring 256-bit AES hardware encryption. Order now for just $129.99 on Amazon!
Help Power Techcratic’s Future – Scan To Support
If Techcratic’s content and insights have helped you, consider giving back by supporting the platform with crypto. Every contribution makes a difference, whether it’s for high-quality content, server maintenance, or future updates. Techcratic is constantly evolving, and your support helps drive that progress.
As a solo operator who wears all the hats, creating content, managing the tech, and running the site, your support allows me to stay focused on delivering valuable resources. Your support keeps everything running smoothly and enables me to continue creating the content you love. I’m deeply grateful for your support, it truly means the world to me! Thank you!
|
BITCOIN
bc1qlszw7elx2qahjwvaryh0tkgg8y68enw30gpvge Scan the QR code with your crypto wallet app |
|
DOGECOIN
D64GwvvYQxFXYyan3oQCrmWfidf6T3JpBA Scan the QR code with your crypto wallet app |
|
ETHEREUM
0xe9BC980DF3d985730dA827996B43E4A62CCBAA7a Scan the QR code with your crypto wallet app |


Please read the Privacy and Security Disclaimer on how Techcratic handles your support.
Disclaimer: As an Amazon Associate, Techcratic may earn from qualifying purchases.


