


![[01_Odyssey] Generative art Exhibition – Dark Room Experience](https://techcratic.com/wp-content/uploads/2025/09/1758190693_maxresdefault-360x180.jpg)


Kayla Zhu
2025-03-21 13:56:00
www.visualcapitalist.com
![]() See this visualization first on the Voronoi app.
See this visualization first on the Voronoi app.
Visualizing The World’s Happiest Countries in 2025
This was originally posted on our Voronoi app. Download the app for free on iOS or Android and discover incredible data-driven charts from a variety of trusted sources.
In an increasingly complex world, happiness remains humanity’s universal pursuit.
Measuring happiness remains a challenge, requiring the blend of objective metrics and subjective experiences, but it offers invaluable insights into the true health of societies beyond economic indicators alone.
In this map, we visualize the findings from the 2025 edition of the World Happiness Report, an annual publication that ranks global happiness based on life evaluations, social support, freedom to make life choices, GDP per capita, and other well-being indicators. It uses data from the Gallup World Poll and additional sources.
The World Happiness Report then averages the scores from life evaluations per country over a three-year period (2022–2024 for this year’s edition) and ranks countries from highest to lowest. Read more about the report’s methodology at the bottom of the article.
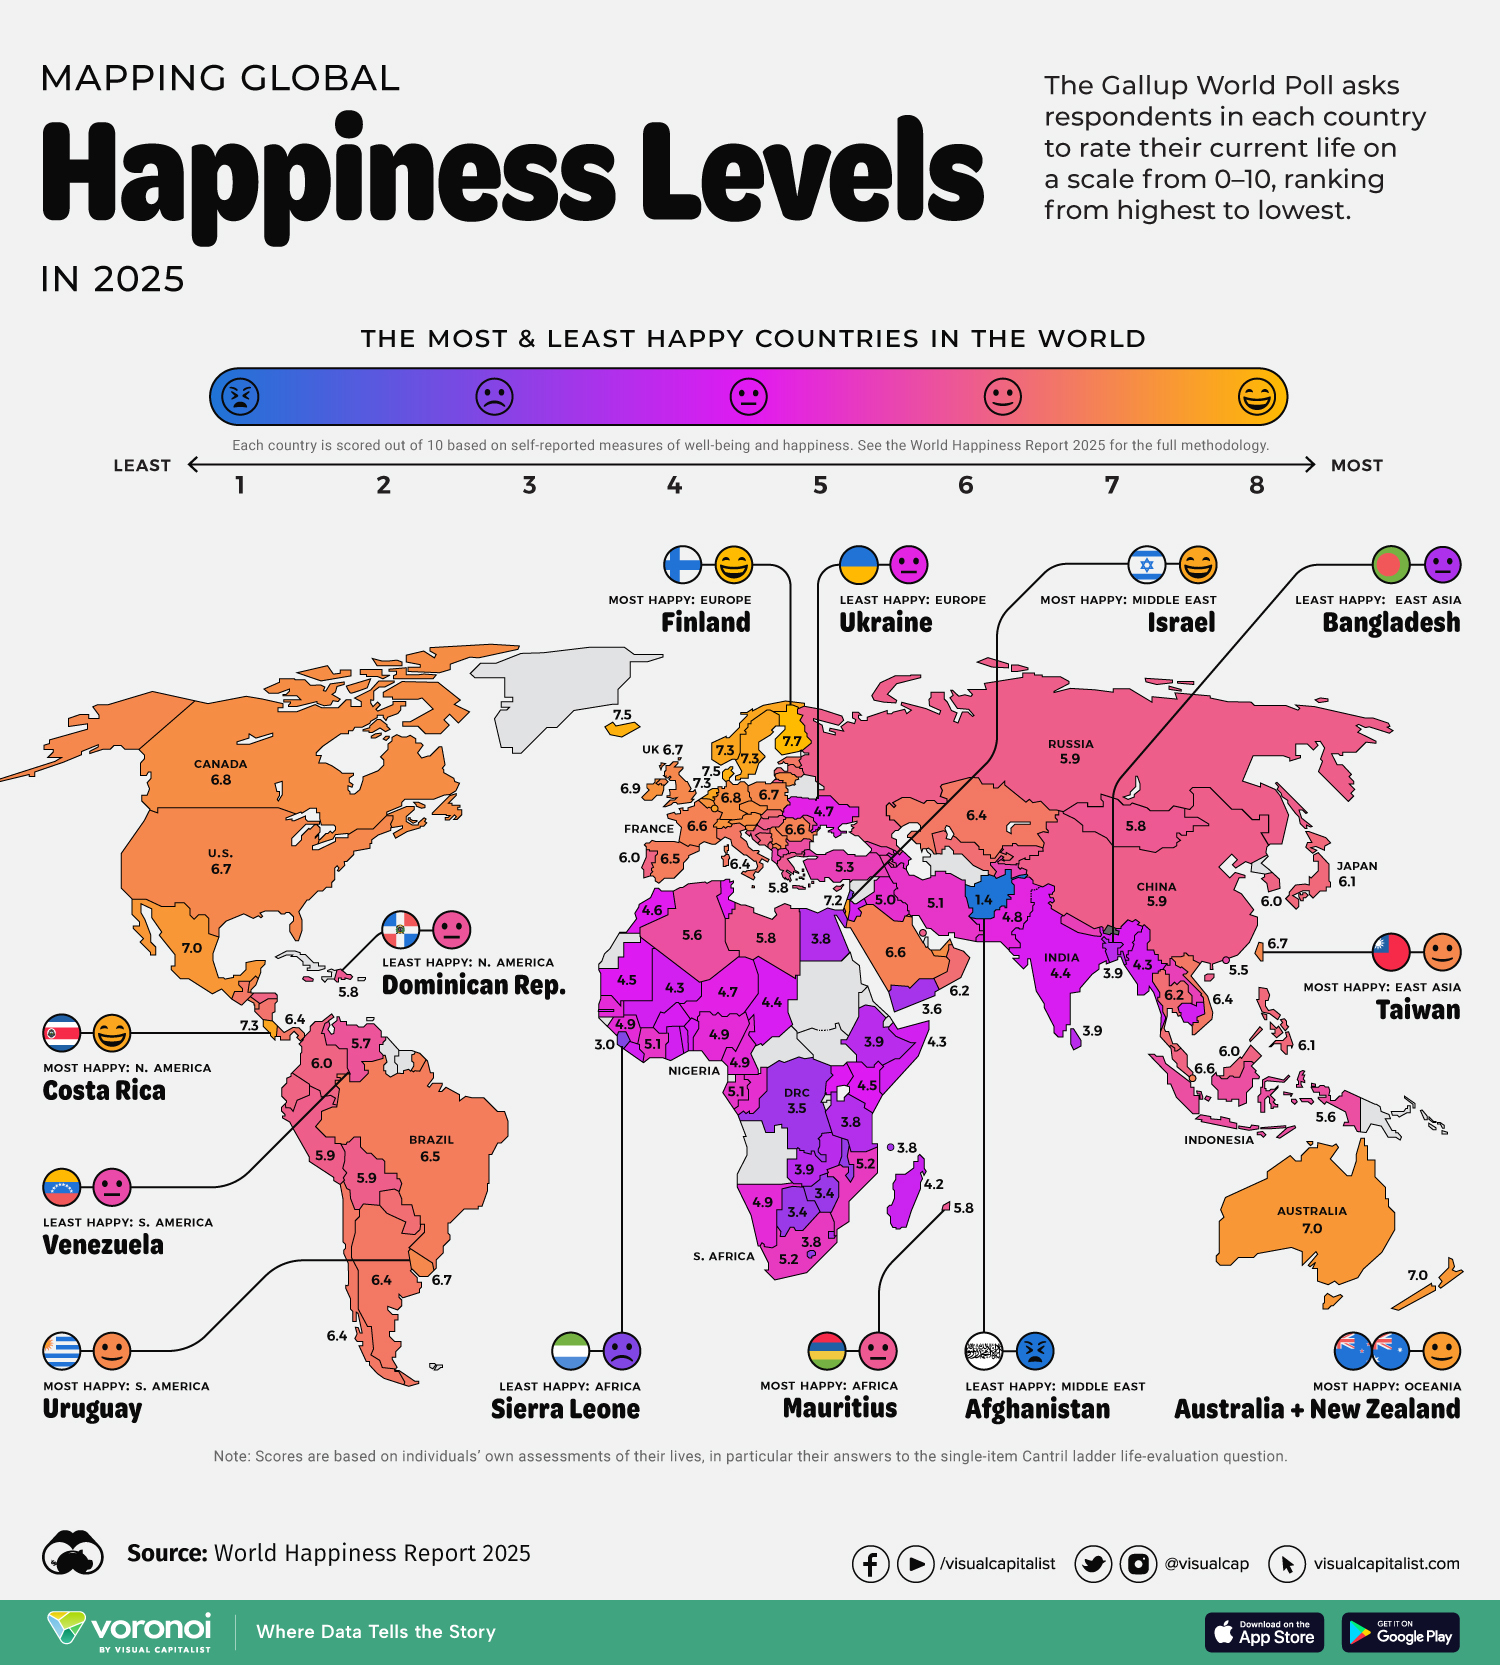
Ranked: The Most & Least Happy Countries in 2025
Below, we show the full rankings from the World Happiness Report 2025, and each country’s score.
| Rank | Country Name | Region | Average Happiness Score (2022-2024) |
|---|---|---|---|
| 1 |  Finland Finland |
Europe | 7.7 |
| 2 |  Denmark Denmark |
Europe | 7.5 |
| 3 |  Iceland Iceland |
Europe | 7.5 |
| 4 |  Sweden Sweden |
Europe | 7.3 |
| 5 |  Netherlands Netherlands |
Europe | 7.3 |
| 6 |  Costa Rica Costa Rica |
Central America | 7.3 |
| 7 |  Norway Norway |
Europe | 7.3 |
| 8 |  Israel Israel |
Middle East | 7.2 |
| 9 |  Luxembourg Luxembourg |
Europe | 7.1 |
| 10 |  Mexico Mexico |
North America | 7.0 |
| 11 |  Australia Australia |
Oceania | 7.0 |
| 12 |  New Zealand New Zealand |
Oceania | 7.0 |
| 13 |  Switzerland Switzerland |
Europe | 6.9 |
| 14 |  Belgium Belgium |
Europe | 6.9 |
| 15 |  Ireland Ireland |
Europe | 6.9 |
| 16 |  Lithuania Lithuania |
Europe | 6.8 |
| 17 |  Austria Austria |
Europe | 6.8 |
| 18 |  Canada Canada |
North America | 6.8 |
| 19 |  Slovenia Slovenia |
Europe | 6.8 |
| 20 |  Czechia Czechia |
Europe | 6.8 |
| 21 |  United Arab Emirates United Arab Emirates |
Middle East | 6.8 |
| 22 |  Germany Germany |
Europe | 6.8 |
| 23 |  United Kingdom United Kingdom |
Europe | 6.7 |
| 24 |  United States United States |
North America | 6.7 |
| 25 |  Belize Belize |
Central America | 6.7 |
| 26 |  Poland Poland |
Europe | 6.7 |
| 27 |  Taiwan Taiwan |
Asia | 6.7 |
| 28 |  Uruguay Uruguay |
South America | 6.7 |
| 29 |  Kosovo Kosovo |
Europe | 6.7 |
| 30 |  Kuwait Kuwait |
Middle East | 6.6 |
| 31 |  Serbia Serbia |
Europe | 6.6 |
| 32 |  Saudi Arabia Saudi Arabia |
Middle East | 6.6 |
| 33 |  France France |
Europe | 6.6 |
| 34 |  Singapore Singapore |
Asia | 6.6 |
| 35 |  Romania Romania |
Europe | 6.6 |
| 36 |  Brazil Brazil |
South America | 6.5 |
| 37 |  El Salvador El Salvador |
Central America | 6.5 |
| 38 |  Spain Spain |
Europe | 6.5 |
| 39 |  Estonia Estonia |
Europe | 6.4 |
| 40 |  Italy Italy |
Europe | 6.4 |
| 41 |  Panama Panama |
Central America | 6.4 |
| 42 |  Argentina Argentina |
South America | 6.4 |
| 43 |  Kazakhstan Kazakhstan |
Asia | 6.4 |
| 44 |  Guatemala Guatemala |
South America | 6.4 |
| 45 |  Chile Chile |
South America | 6.4 |
| 46 |  Vietnam Vietnam |
Asia | 6.4 |
| 47 |  Nicaragua Nicaragua |
Central America | 6.3 |
| 48 |  Malta Malta |
Europe | 6.3 |
| 49 |  Thailand Thailand |
Asia | 6.2 |
| 50 |  Slovakia Slovakia |
Europe | 6.2 |
| 51 |  Latvia Latvia |
Europe | 6.2 |
| 52 |  Oman Oman |
Middle East | 6.2 |
| 53 |  Uzbekistan Uzbekistan |
Asia | 6.2 |
| 54 |  Paraguay Paraguay |
South America | 6.2 |
| 55 |  Japan Japan |
Asia | 6.1 |
| 56 |  Bosnia and Herzegovina Bosnia and Herzegovina |
Europe | 6.1 |
| 57 |  Philippines Philippines |
Asia | 6.1 |
| 58 |  Republic of Korea Republic of Korea |
Asia | 6.0 |
| 59 |  Bahrain Bahrain |
Middle East | 6.0 |
| 60 |  Portugal Portugal |
Europe | 6.0 |
| 61 |  Colombia Colombia |
South America | 6.0 |
| 62 |  Ecuador Ecuador |
South America | 6.0 |
| 63 |  Honduras Honduras |
Central America | 6.0 |
| 64 |  Malaysia Malaysia |
Asia | 6.0 |
| 65 |  Peru Peru |
South America | 5.9 |
| 66 |  Russia Russia |
Europe | 5.9 |
| 67 |  Cyprus Cyprus |
Europe | 5.9 |
| 68 |  China China |
Asia | 5.9 |
| 69 |  Hungary Hungary |
Europe | 5.9 |
| 70 |  Trinidad and Tobago Trinidad and Tobago |
North America | 5.9 |
| 71 |  Montenegro Montenegro |
Europe | 5.9 |
| 72 |  Croatia Croatia |
Europe | 5.9 |
| 73 |  Jamaica Jamaica |
Central America | 5.9 |
| 74 |  Bolivia Bolivia |
South America | 5.9 |
| 75 |  Kyrgyzstan Kyrgyzstan |
Asia | 5.9 |
| 76 |  Dominican Republic Dominican Republic |
Central America | 5.8 |
| 77 |  Mongolia Mongolia |
Asia | 5.8 |
| 78 |  Mauritius Mauritius |
Africa | 5.8 |
| 79 |  Libya Libya |
Africa | 5.8 |
| 80 |  Moldova Moldova |
Europe | 5.8 |
| 81 |  Greece Greece |
Europe | 5.8 |
| 82 |  Venezuela Venezuela |
South America | 5.7 |
| 83 |  Indonesia Indonesia |
Asia | 5.6 |
| 84 |  Algeria Algeria |
Africa | 5.6 |
| 85 |  Bulgaria Bulgaria |
Europe | 5.6 |
| 86 |  North Macedonia North Macedonia |
Europe | 5.5 |
| 87 |  Armenia Armenia |
Asia | 5.5 |
| 88 |  Hong Kong Hong Kong |
Asia | 5.5 |
| 89 |  Albania Albania |
Europe | 5.4 |
| 90 |  Tajikistan Tajikistan |
Asia | 5.4 |
| 91 |  Georgia Georgia |
Europe | 5.4 |
| 92 |  Nepal Nepal |
Asia | 5.3 |
| 93 |  Laos Laos |
Asia | 5.3 |
| 94 |  Türkiye Türkiye |
Asia | 5.3 |
| 95 |  South Africa South Africa |
Africa | 5.2 |
| 96 |  Mozambique Mozambique |
Africa | 5.2 |
| 97 |  Gabon Gabon |
Africa | 5.1 |
| 98 | Côte d’Ivoire |
Africa | 5.1 |
| 99 |  Iran Iran |
Middle East | 5.1 |
| 100 |  Congo Congo |
Africa | 5.0 |
| 101 |  Iraq Iraq |
Middle East | 5.0 |
| 102 |  Guinea Guinea |
Africa | 4.9 |
| 103 |  Namibia Namibia |
Africa | 4.9 |
| 104 |  Cameroon Cameroon |
Africa | 4.9 |
| 105 |  Nigeria Nigeria |
Africa | 4.9 |
| 106 |  Azerbaijan Azerbaijan |
Asia | 4.9 |
| 107 |  Senegal Senegal |
Africa | 4.9 |
| 108 |  Palestine Palestine |
Middle East | 4.8 |
| 109 |  Pakistan Pakistan |
Asia | 4.8 |
| 110 | Niger |
Africa | 4.7 |
| 111 |  Ukraine Ukraine |
Europe | 4.7 |
| 112 |  Morocco Morocco |
Africa | 4.6 |
| 113 |  Tunisia Tunisia |
Africa | 4.6 |
| 114 |  Mauritania Mauritania |
Africa | 4.5 |
| 115 |  Kenya Kenya |
Africa | 4.5 |
| 116 |  Uganda Uganda |
Africa | 4.5 |
| 117 | Gambia |
Africa | 4.4 |
| 118 |  India India |
Asia | 4.4 |
| 119 |  Chad Chad |
Africa | 4.4 |
| 120 |  Burkina Faso Burkina Faso |
Africa | 4.4 |
| 121 |  Benin Benin |
Africa | 4.4 |
| 122 |  Somalia Somalia |
Africa | 4.3 |
| 123 |  Mali Mali |
Africa | 4.3 |
| 124 |  Cambodia Cambodia |
Asia | 4.3 |
| 125 |  Ghana Ghana |
Africa | 4.3 |
| 126 |  Myanmar Myanmar |
Asia | 4.3 |
| 127 |  Togo Togo |
Africa | 4.3 |
| 128 |  Jordan Jordan |
Middle East | 4.3 |
| 129 |  Liberia Liberia |
Africa | 4.3 |
| 130 |  Madagascar Madagascar |
Africa | 4.2 |
| 131 |  Zambia Zambia |
Africa | 3.9 |
| 132 |  Ethiopia Ethiopia |
Africa | 3.9 |
| 133 |  Sri Lanka Sri Lanka |
Asia | 3.9 |
| 134 |  Bangladesh Bangladesh |
Asia | 3.9 |
| 135 |  Egypt Egypt |
Africa | 3.8 |
| 136 |  Tanzania Tanzania |
Africa | 3.8 |
| 137 |  Eswatini Eswatini |
Africa | 3.8 |
| 138 | Lesotho |
Africa | 3.8 |
| 139 |  Comoros Comoros |
Africa | 3.8 |
| 140 |  Yemen Yemen |
Middle East | 3.6 |
| 141 |  Democratic Republic of the Congo Democratic Republic of the Congo |
Africa | 3.5 |
| 142 |  Botswana Botswana |
Africa | 3.4 |
| 143 |  Zimbabwe Zimbabwe |
Africa | 3.4 |
| 144 |  Malawi Malawi |
Africa | 3.3 |
| 145 |  Lebanon Lebanon |
Middle East | 3.2 |
| 146 |  Sierra Leone Sierra Leone |
Africa | 3.0 |
| 147 |  Afghanistan Afghanistan |
Middle East | 1.4 |
Nordic countries continue to dominate global happiness rankings, with Finland maintaining its first-place position for the eighth consecutive year with a steady score of 7.7, unchanged from last year.
Denmark, Iceland, and Sweden follow closely behind, preserving their respective rankings from last year’s report.
Notable departures from the top 10 include Australia, which slipped from #10 to #11.
Israel dropped from #5 to #8 this year but remains in the top 10. Despite the ongoing Gaza war—which began in 2023 and is largely reflected in this year’s three-year average—Israel remains one of the world’s happiest countries.
One of the biggest shifts in rankings came from Costa Rica, which climbed from #12 to #6, achieving both the highest-ever ranking for a Latin American country and the strongest placement of any non-European nation in this year’s report.
Most and Least Happy Countries by Region
In this table, we show the most and least happy countries in each region.
| Region | Happiest Country | 2024 Happiness Score | Least Happiest Country | 2024 Happiness Score |
|---|---|---|---|---|
| North America | Costa Rica |
7.3 | Dominican Republic |
5.8 |
| South America | Uruguay |
6.7 | Venezuela |
5.7 |
| Europe | Finland |
7.7 | Ukraine |
4.7 |
| Middle East | Israel |
7.2 | Afghanistan |
1.4 |
| East Asia | Taiwan |
6.7 | Bangladesh |
3.9 |
| Africa | Mauritius |
5.8 | Sierra Leone |
3.0 |
| Oceania | Australia & New Zealand |
7.0 | — | — |
Sixth-ranked Costa Rica is the happiest country in North America, surpassing both the U.S. and Canada. On the other end, the Dominican Republic (#76) ranks as the least happy in the region, likely due to economic challenges and inequality.
Uruguay, ranked 28th this year, continues to be South America’s happiest country. Meanwhile, Venezuela (#82) also remains the least happy due to ongoing economic collapse, political instability, and mass emigration, which have severely affected quality of life.
In Europe, Ukraine (#111) ranks the lowest, still suffering from the ongoing impacts of war, economic instability, and uncertainty about the future.
In the Middle East, last-place Afghanistan remains the world’s least happy country, with ongoing conflict, restrictions on freedoms—particularly for women—and economic hardship leading to the lowest recorded happiness score. The country has been the unhappiest country in the world since 2020.
This year, Taiwan surpassed Singapore as East Asia’s happiest country with a rank of #27. Bangladesh ranked the lowest among Asian economies at #134 due to economic struggles and ongoing political instability.
In Africa, which has the lowest average scores in the world, Mauritius (#78) is the continent’s happiest country, thanks to relative prosperity compared to its neighbors. In contrast, second-last Sierra Leone has the lowest happiness score on the continent, reflecting high poverty levels, political corruption, and weak infrastructure.
In the Oceania region, Australia and New Zealand both record high scores of 7.0, just shy of the top 10. Both countries benefit from high life expectancy and strong social infrastructure.
Which Countries Saw the Greatest Change in Happiness?
Below, we show the three countries that saw the largest increases to their happiness scores from last year, and the three countries that saw the greatest decreases.
| Country | 2023 Happiness Score | 2024 Happiness Score | Change in score |
|---|---|---|---|
| Lesotho |
3.2 | 3.8 | 0.6 |
| Lebanon |
2.7 | 3.2 | 0.5 |
| Zambia |
3.5 | 3.9 | 0.4 |
| Sierra Leone |
3.3 | 3.0 | -0.3 |
| Kuwait |
7.0 | 6.6 | -0.3 |
| Afghanistan |
1.7 | 1.4 | -0.4 |
Lesotho saw the biggest increase in their happiness score out of all countries surveyed, jumping 0.6 points from 3.2 to 3.8. However, despite this improvement, it remains among the least happy nations in the world.
Similarly, Lebanon and Zambia also experienced the largest increases in scores but still rank near the bottom, highlighting how even the most improved countries continue to struggle with deep-rooted economic and political challenges.
Conversely, some of the world’s least happy countries saw their scores decline further. Sierra Leone, Kuwait, and Afghanistan recorded the largest drops, with declines ranging from 0.3 to 0.4 points.
Which Countries Moved Up the Happiness Rankings Most?
Looking at ranking shifts, Latin American countries made the biggest jumps, signaling a rebound in optimism despite economic and political challenges. Colombia, Mexico, and Ecuador saw the largest gains, climbing 17, 15, and 12 spots, respectively.
Colombia moved from #78 to #61, Mexico entered the top 10 for the first time, rising from #25 to #10, and Ecuador improved from #74 to #62.
Meanwhile, the United States dropped one spot from #23 to #24, continuing a downward trend that has persisted since 2016. Declining social trust and rising inequality remain key factors in the U.S.’s long-term slide in happiness rankings.
Where does this data come from?
Source: The World Happiness Report which leverages data from the Gallup World Poll.
Methodology: The World Happiness Report derives its rankings from Gallup World Poll data, surveying approximately 1,000 people per country per year across 140+ countries. The total sample size typically exceeds 140,000 respondents annually. The rankings are based on three-year averages, from 2022 to 2024. Respondents evaluate their lives using the Cantril Ladder, a 0-to-10 scale. The rankings are based on six key factors: GDP per capita, healthy life expectancy, social support, freedom to make life choices, generosity (measured by charitable acts), and perceptions of corruption. In addition to life evaluations, the report examines emotional well-being through positive and negative affect indicators, such as laughter, worry, and sadness. The 2025 edition also emphasizes social trust and benevolence, analyzing behaviors like sharing meals, helping strangers, and returning lost wallets to assess how caring and community engagement contribute to happiness.
Criticisms: Critics of the World Happiness Report point out that survey questions measure satisfaction with socioeconomic conditions as opposed to individual emotional happiness. As well, there are myriad cultural differences around the world that influence how people think about happiness and life satisfaction. Finally, there can be big differences in life satisfaction between groups within a country, which are averaged out even in a nationally representative group. The report does acknowledge inequality as a factor by measuring the “gap” between the most and least happy halves of each country.
Learn More on the Voronoi App 
To compare country happiness rankings from a different source, check out this graphic that visualizes the happiest countries among the world’s major economies, based on analysis from Ray Dalio’s Great Powers Index 2024.
The post Mapped: Global Happiness by Country in 2025 appeared first on Visual Capitalist.

Keep your files stored safely and securely with the SanDisk 2TB Extreme Portable SSD. With over 69,505 ratings and an impressive 4.6 out of 5 stars, this product has been purchased over 8K+ times in the past month. At only $129.99, this Amazon’s Choice product is a must-have for secure file storage.
Help keep private content private with the included password protection featuring 256-bit AES hardware encryption. Order now for just $129.99 on Amazon!
Help Power Techcratic’s Future – Scan To Support
If Techcratic’s content and insights have helped you, consider giving back by supporting the platform with crypto. Every contribution makes a difference, whether it’s for high-quality content, server maintenance, or future updates. Techcratic is constantly evolving, and your support helps drive that progress.
As a solo operator who wears all the hats, creating content, managing the tech, and running the site, your support allows me to stay focused on delivering valuable resources. Your support keeps everything running smoothly and enables me to continue creating the content you love. I’m deeply grateful for your support, it truly means the world to me! Thank you!
|
BITCOIN
bc1qlszw7elx2qahjwvaryh0tkgg8y68enw30gpvge Scan the QR code with your crypto wallet app |
|
DOGECOIN
D64GwvvYQxFXYyan3oQCrmWfidf6T3JpBA Scan the QR code with your crypto wallet app |
|
ETHEREUM
0xe9BC980DF3d985730dA827996B43E4A62CCBAA7a Scan the QR code with your crypto wallet app |


Please read the Privacy and Security Disclaimer on how Techcratic handles your support.
Disclaimer: As an Amazon Associate, Techcratic may earn from qualifying purchases.


