


![[Download] Intuitive 3D Modeling | Abstract Sculpture | FLIGHT | DANA KRYSTLE](https://techcratic.com/wp-content/uploads/2025/08/1755630966_maxresdefault-360x180.jpg)


Pallavi Rao
2025-04-07 08:11:00
www.visualcapitalist.com
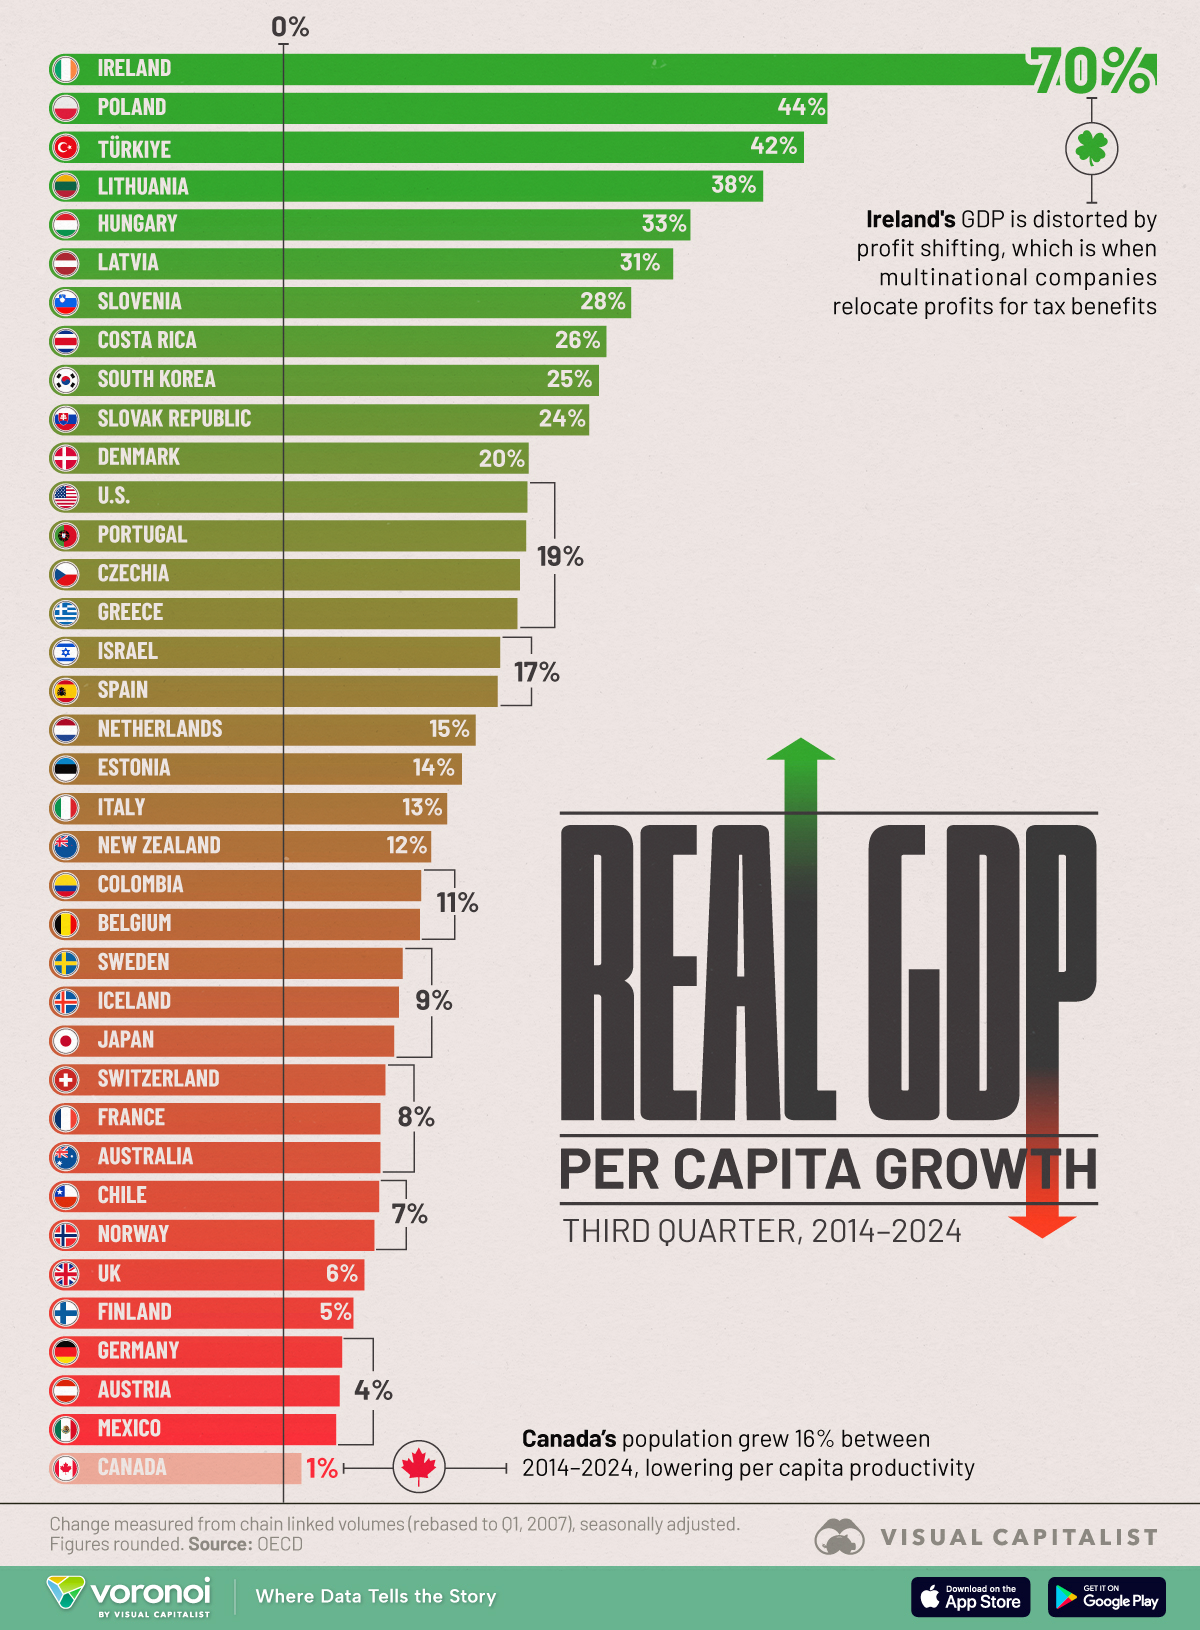
Real GDP Per Capita Growth by Country (2014-2024)
This was originally posted on our Voronoi app. Download the app for free on iOS or Android and discover incredible data-driven charts from a variety of trusted sources.
Key Takeaways
- Canada saw only 1.1% growth in real GDP per capita between 2014–2024.
- Its performance is second-worst amongst a group of 38 high-income economies.
Measuring economic growth (and related standard of living improvement) is always dogged by inflation worries—that price increases are masking output falls (or stagnation).
For a meaningful comparison, we visualize real GDP per capita growth across a group of peer economies, calculated from data in this OECD database.
The dataset measures every country’s per capita output volumes every year, seasonally-adjusted and indexed to 2007. This removes the influence of prices on productivity growth.
 The OECD is a group of mostly high-income countries that adhere to stricter data reporting guidelines which allows these metrics to be calculated.
 Canada’s Productivity Problems, Explained
Canada saw only 1.1% growth in real GDP per capita between 2014–2024
Its performance is second-worst amongst a group of 38 major economies. Only Luxembourg (not visualized, but present in the dataset below) is worse.
| Country/Region | Real GDP Per Capita, 2014–2024), % Change |
|---|---|
 Luxembourg Luxembourg |
0.0 |
 Canada Canada |
1.1 |
 Mexico Mexico |
3.9 |
 Austria Austria |
4.2 |
 Germany Germany |
4.4 |
 Finland Finland |
5.3 |
 UK UK |
6.2 |
 Norway Norway |
7.0 |
 Chile Chile |
7.4 |
 Australia Australia |
7.5 |
 France France |
7.5 |
 Switzerland Switzerland |
7.9 |
 Japan Japan |
8.6 |
 Iceland Iceland |
9.0 |
 Sweden Sweden |
9.3 |
 Belgium Belgium |
10.7 |
 Colombia Colombia |
10.8 |
 New Zealand New Zealand |
11.6 |
 Italy Italy |
12.9 |
 Estonia Estonia |
14.1 |
 Netherlands Netherlands |
15.2 |
 Spain Spain |
17.0 |
 Israel Israel |
17.2 |
 Greece Greece |
18.6 |
 Czechia Czechia |
18.8 |
 Portugal Portugal |
19.3 |
 U.S. U.S. |
19.4 |
 Denmark Denmark |
19.5 |
 Slovak Republic Slovak Republic |
24.4 |
 South Korea South Korea |
25.2 |
 Costa Rica Costa Rica |
25.8 |
 Slovenia Slovenia |
27.8 |
 Latvia Latvia |
31.2 |
 Hungary Hungary |
32.6 |
 Lithuania Lithuania |
38.5 |
 Türkiye Türkiye |
41.8 |
 Poland Poland |
43.7 |
 Ireland Ireland |
70.4 |
| EU | 14.7 |
| OECD | 14.8 |
Note: Figures are rounded in the graphic.
So, why has Canadian economic productivity nosedived in the last decade? There’s simple arithmetic at play here.
While its gross domestic product itself has grown around 17% in inflation-adjusted terms, so has its population.
As a result, its per capita GDP has barely moved in 10 years.
For context, real GDP per capita across the G7, EU, and OECD have all grown 15% in the same time period.
Also What’s Going on With Ireland?
Ireland is the other outlier in this dataset, registering a 70% real GDP per capita growth in 10 years.
This number may seem too good to be true. And that is because it is: Ireland’s GDP accounting is heavily influenced by external factors.
Profit shifting and the heavy influence of intellectual property assets held by multinational corporations headquartered in the country both inflate the GDP relative to actual economic activity within Ireland.
As a result, its per capita GDP (and growth) is also significantly inflated.
The Irish government itself prefers to use gross national income (GNI) to measure economic progress.
Learn More on the Voronoi App 
Want more peer comparisons for this group of high-income countries? Check out: Annual Wages Compared Across the OECD to see where workers earn the most.
The post Ranked: Real GDP Per Capita Growth by Country (2014-2024) appeared first on Visual Capitalist.

Keep your files stored safely and securely with the SanDisk 2TB Extreme Portable SSD. With over 69,505 ratings and an impressive 4.6 out of 5 stars, this product has been purchased over 8K+ times in the past month. At only $129.99, this Amazon’s Choice product is a must-have for secure file storage.
Help keep private content private with the included password protection featuring 256-bit AES hardware encryption. Order now for just $129.99 on Amazon!
Help Power Techcratic’s Future – Scan To Support
If Techcratic’s content and insights have helped you, consider giving back by supporting the platform with crypto. Every contribution makes a difference, whether it’s for high-quality content, server maintenance, or future updates. Techcratic is constantly evolving, and your support helps drive that progress.
As a solo operator who wears all the hats, creating content, managing the tech, and running the site, your support allows me to stay focused on delivering valuable resources. Your support keeps everything running smoothly and enables me to continue creating the content you love. I’m deeply grateful for your support, it truly means the world to me! Thank you!
|
BITCOIN
bc1qlszw7elx2qahjwvaryh0tkgg8y68enw30gpvge Scan the QR code with your crypto wallet app |
|
DOGECOIN
D64GwvvYQxFXYyan3oQCrmWfidf6T3JpBA Scan the QR code with your crypto wallet app |
|
ETHEREUM
0xe9BC980DF3d985730dA827996B43E4A62CCBAA7a Scan the QR code with your crypto wallet app |


Please read the Privacy and Security Disclaimer on how Techcratic handles your support.
Disclaimer: As an Amazon Associate, Techcratic may earn from qualifying purchases.


