


![[Download] Intuitive 3D Modeling | Abstract Sculpture | FLIGHT | DANA KRYSTLE](https://techcratic.com/wp-content/uploads/2025/08/1755630966_maxresdefault-360x180.jpg)


![[DEBUT COVER] Intergalactic Bound – Yunosuke / CircusP [MIKU EXPO 10th]](https://techcratic.com/wp-content/uploads/2025/08/1755598927_maxresdefault-360x180.jpg)
Chris Dickert
2025-04-13 14:12:00
www.visualcapitalist.com
Visualizing Global Commodity Production in the 1920s
This map is the latest in our Vintage Viz series, which presents historical visualizations along with the context needed to understand them.
The year was 1927. Art deco and surrealism were making their debut, the Jazz Age was in full swing, and depending on where you lived, you called this decade either roaring (U.S.), golden (Germany), or even crazy (France).
The second decade of the 20th century was also a period of rapid economic expansion, as Fordism and mass consumer culture took hold in the years following World War I. And nowhere is that more apparent than in the 1927 edition of Prof. Hickmann’s Universal Geographical and Statistical Atlas.
Published in German by the Austrian publisher G. Freytag & Berndt, the atlas contains 80 pages of statistics, charts, and visualizations on a range of themes. In this edition of Vintage Viz, we take a look at just eight of those pages, which cover global commodity production.
Translations: Sprechen Sie Deutsche?
To help out those of us who don’t read German, we’ve included translations of the major content below; just click to expand the items.
a.bg-showmore-plg-link:hover,a.bg-showmore-plg-link:active,a.bg-showmore-plg-link:focus{color:#0071bb;}
Agricultural Production
Click on graphics to view them in high resolution.

Translations: Produktion I
a.bg-showmore-plg-link:hover,a.bg-showmore-plg-link:active,a.bg-showmore-plg-link:focus{color:#0071bb;}
Translations: Produktion II
a.bg-showmore-plg-link:hover,a.bg-showmore-plg-link:active,a.bg-showmore-plg-link:focus{color:#0071bb;}
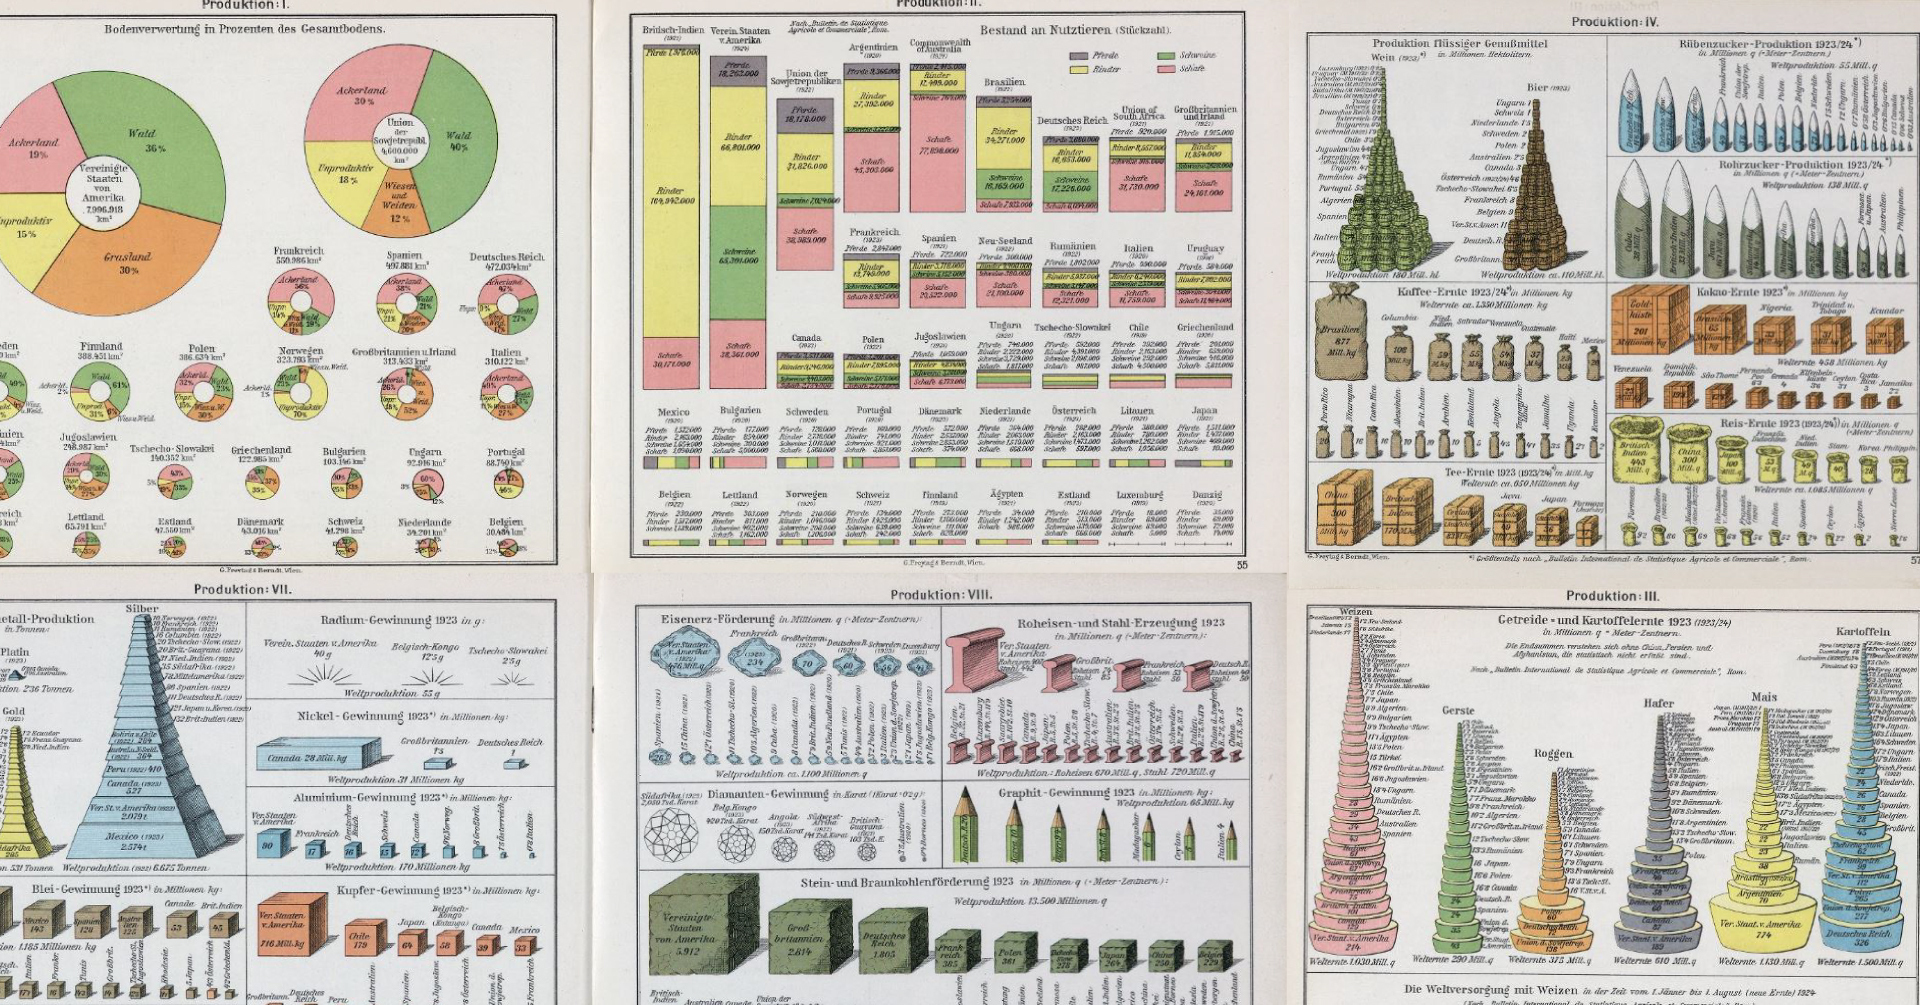
Produktion I covers land-use (Bodenverwertung in Prozenten des Gesamtbodens) by country. Finland, with its vast tracts of boreal forest, had the largest share of woodlands at 61% of total land coverage. According to 2021 figures from the World Bank, Finland’s forests have actually grown since then, now covering 73.7% of the country. France had the highest proportion of arable land, at 56%, while Norway, with its rugged northern geography, had the largest share of “unproductive” land at 70%.
Turning to livestock, the biggest producer was British India (then a colony), with 197 million heads of horse, cattle, sheep, and pigs. In a close second was the U.S., with 188 million head. Note that livestock statistics don’t all come from the same year.
Grains and Potatoes, Beer and Wine
Click on graphics to view them in high resolution.

Translations: Produktion III
a.bg-showmore-plg-link:hover,a.bg-showmore-plg-link:active,a.bg-showmore-plg-link:focus{color:#0071bb;}
Translations: Produktion IV
a.bg-showmore-plg-link:hover,a.bg-showmore-plg-link:active,a.bg-showmore-plg-link:focus{color:#0071bb;}
On Produktion III, we see that the U.S. was an agricultural powerhouse, producing the largest amounts of most grains, except for rye where the U.S.S.R. was first, and potatoes where Germany was top spud. The bottom visualization shows how surplus grain moved from exporting agricultural producers (Argentina, Canada, the U.S., etc…) to grain importing nations, including the UK and Germany.
On Produktion IV, we have the production of wine and beer, depicted as stacks of barrels. Perhaps it’s no surprise that France edged out Italy as the top wine producer in 1923, while the UK was just ahead of Germany for first place in beer production at 30 million hectoliters (a hectoliter is 100 liters).
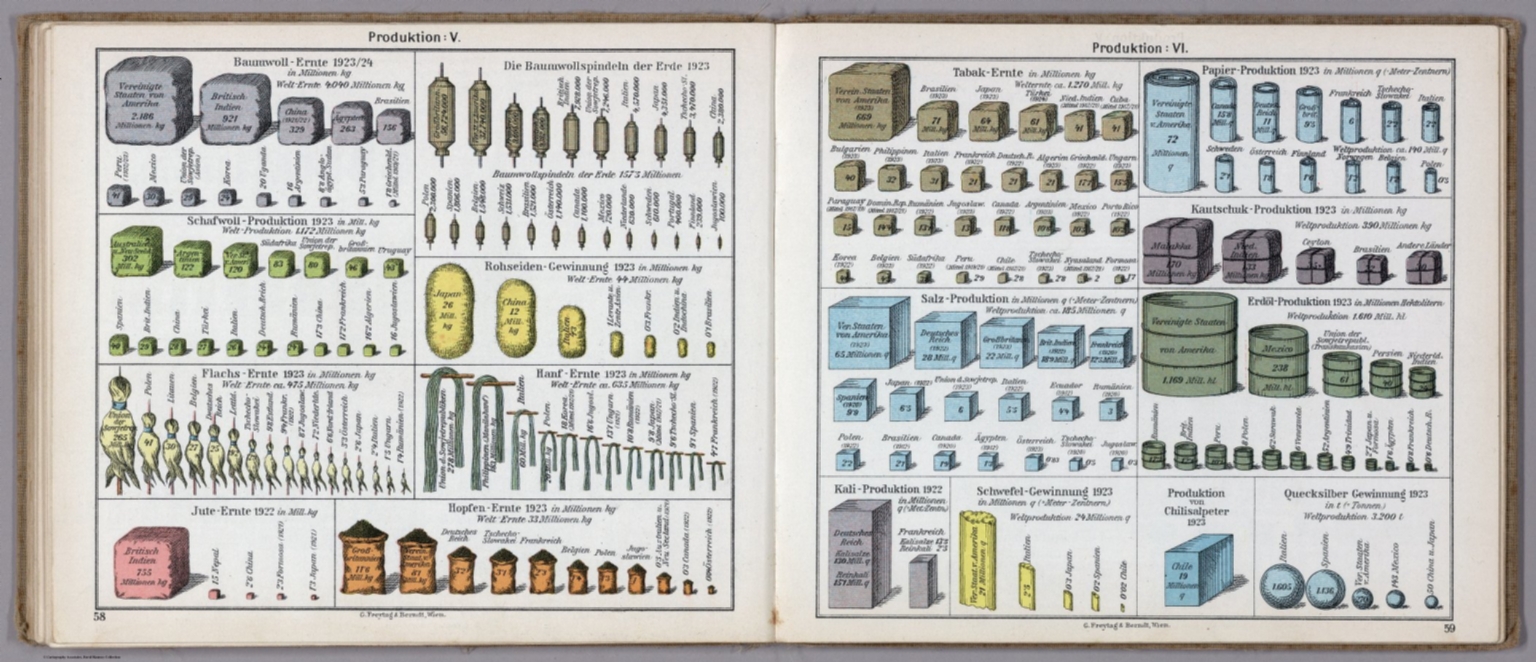
Wool and Silk, Oil and Quicksilver
Click on graphics to view them in high resolution.
Translations: Produktion V
a.bg-showmore-plg-link:hover,a.bg-showmore-plg-link:active,a.bg-showmore-plg-link:focus{color:#0071bb;}
Translations: Produktion VI
a.bg-showmore-plg-link:hover,a.bg-showmore-plg-link:active,a.bg-showmore-plg-link:focus{color:#0071bb;}
On Produktion V we have textiles, including silk production. Historically, the cultivation of silk was restricted to China, where it was guarded as a state secret. The story goes that two sixth-century monks smuggled silkworm eggs out of the country hidden in a bamboo pole and presented them to the Byzantine court of Justinian I. Eventually, the secret made its way to the Arabs, then to Italy and later France by returning Crusaders.
Perhaps most interesting on Produktion VI is the breakdown of oil producers. One hundred years ago, the top producer was the U.S., a position that it has recently retaken thanks to the shale revolution. Figures are presented in millions of hectoliters but converted into barrels, the U.S produced just over 753,000 barrels in 1923. To put that in perspective, the U.S. produced 21.4 million barrels of oil every day in the fourth quarter of 2023.
Metals and Gems, Coal and Coke
Click on graphics to view them in high resolution.

Translations: Produktion VII
a.bg-showmore-plg-link:hover,a.bg-showmore-plg-link:active,a.bg-showmore-plg-link:focus{color:#0071bb;}
Translations: Produktion VIII
a.bg-showmore-plg-link:hover,a.bg-showmore-plg-link:active,a.bg-showmore-plg-link:focus{color:#0071bb;}
On Produktion VII and VIII, we have a breakdown of global mining output for a variety of strategic and precious metals. Back then, South Africa was the world’s largest gold producer at 285 metric tons, as well as the top diamond producer (2 million carats), while Mexico was 1923’s largest silver producer.
Strategic metals, on the other hand, were produced mainly by Western industrialized countries of the day. The U.S., which had overtaken the UK as the world’s largest economy following WWI, was the largest producer of pig iron and steel, iron ore, coke, and coal and lignite. The UK only maintained its lead in the production of gas coke.
A Last Gasp Before a Fall
The atlas presents a snapshot of a world on the cusp of the Great Depression, and if we looked at a version published just a few short years later it would likely show a remarkably different picture. Instead of a time of economic growth and increased exports, it was one of unemployment, isolationism, and eventually, clouded by war.
But in 1927, the Goldene Zwanziger Jahre—the Golden Twenties as they were called in Germany—were still going strong.
 |
Want to dive deeper into more vintage maps and visualizations?
VC+ members will be receiving a special feature in their inboxes on Wednesday, December 27th, 2023 deconstructing three historical maps that got it (very) wrong. VC+ gives access to:
|
The post Visualizing Global Commodity Production in the 1920s appeared first on Visual Capitalist.

Keep your files stored safely and securely with the SanDisk 2TB Extreme Portable SSD. With over 69,505 ratings and an impressive 4.6 out of 5 stars, this product has been purchased over 8K+ times in the past month. At only $129.99, this Amazon’s Choice product is a must-have for secure file storage.
Help keep private content private with the included password protection featuring 256-bit AES hardware encryption. Order now for just $129.99 on Amazon!
Help Power Techcratic’s Future – Scan To Support
If Techcratic’s content and insights have helped you, consider giving back by supporting the platform with crypto. Every contribution makes a difference, whether it’s for high-quality content, server maintenance, or future updates. Techcratic is constantly evolving, and your support helps drive that progress.
As a solo operator who wears all the hats, creating content, managing the tech, and running the site, your support allows me to stay focused on delivering valuable resources. Your support keeps everything running smoothly and enables me to continue creating the content you love. I’m deeply grateful for your support, it truly means the world to me! Thank you!
|
BITCOIN
bc1qlszw7elx2qahjwvaryh0tkgg8y68enw30gpvge Scan the QR code with your crypto wallet app |
|
DOGECOIN
D64GwvvYQxFXYyan3oQCrmWfidf6T3JpBA Scan the QR code with your crypto wallet app |
|
ETHEREUM
0xe9BC980DF3d985730dA827996B43E4A62CCBAA7a Scan the QR code with your crypto wallet app |


Please read the Privacy and Security Disclaimer on how Techcratic handles your support.
Disclaimer: As an Amazon Associate, Techcratic may earn from qualifying purchases.


