


![[Download] Intuitive 3D Modeling | Abstract Sculpture | FLIGHT | DANA KRYSTLE](https://techcratic.com/wp-content/uploads/2025/08/1755630966_maxresdefault-360x180.jpg)


![[DEBUT COVER] Intergalactic Bound – Yunosuke / CircusP [MIKU EXPO 10th]](https://techcratic.com/wp-content/uploads/2025/08/1755598927_maxresdefault-360x180.jpg)

Pallavi Rao
2025-04-16 08:11:00
www.visualcapitalist.com
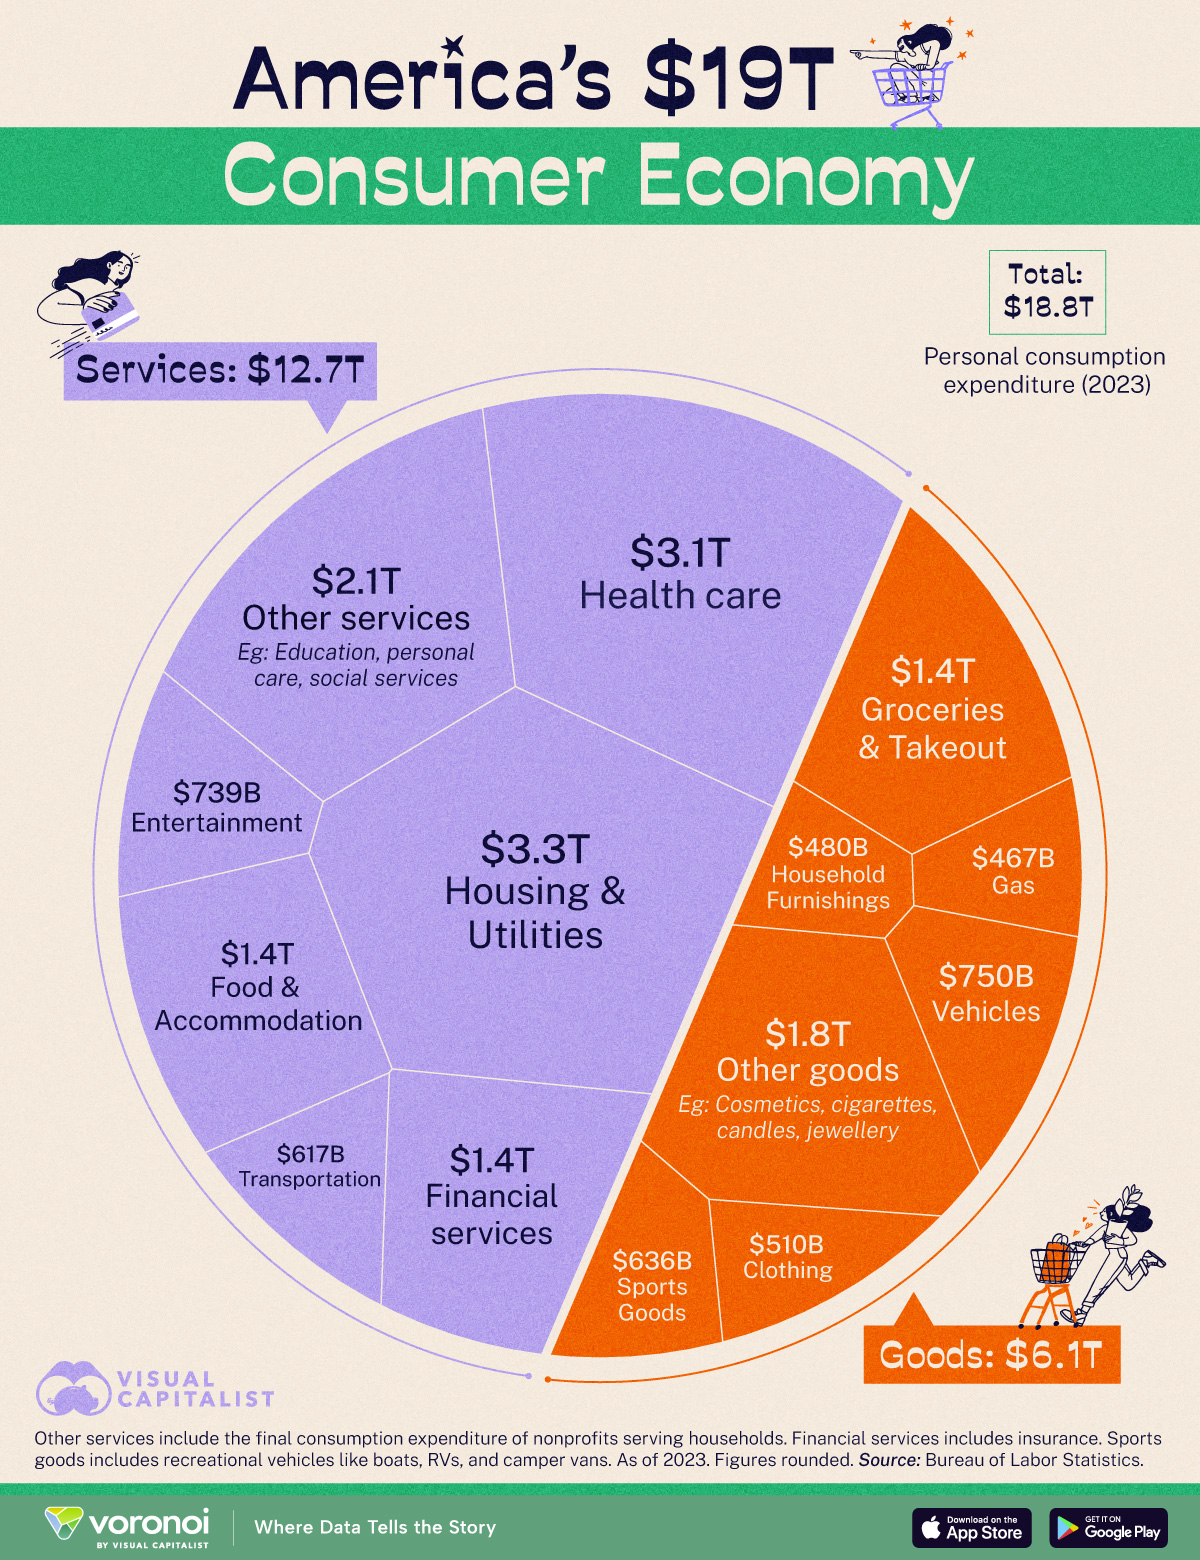
America’s $19 Trillion Consumer Economy in One Chart
This was originally posted on our Voronoi app. Download the app for free on iOS or Android and discover incredible data-driven charts from a variety of trusted sources.
Key Takeaways
- America’s consumer class spent nearly $19 trillion on goods and services in 2023.
- Housing and utilities ($3.3T) and health care (3.1T) were the top expenditure categories overall.
- Americans spent the most money on groceries ($1.4$T) in the goods category.
To no one’s surprise, the world’s largest economy is also the world’s largest consumer economy.
But how much do Americans collectively spend on the goods and services they need? And what items draw the largest share? We visualize data from the Bureau of Labor Statistics for further analysis.
Where Americans Spend Their Money
America’s consumer class spent nearly $19 trillion on goods and services in 2023.
For context, this was about 68% of the U.S. GDP that year. It was also larger than China’s overall GDP that year as well ($17.8T).
| Expenditure Type | 2023 Personal Consumption Expenditure |
Category |
|---|---|---|
 Housing & Utilities Housing & Utilities |
$3.3T | Services |
 Health care Health care |
$3.1T | Services |
 Financial services Financial services& Insurance |
$1.4T | Services |
 Food & Accommodations Food & Accommodations |
$1.4T | Services |
 Entertainment Entertainment |
$739B | Services |
 Transportation Transportation |
$617B | Services |
 Other services Other services |
$2.1T | Services |
 Groceries & Takeout Groceries & Takeout |
$1.4T | Goods |
 Vehicles Vehicles |
$750B | Goods |
 Household Furnishings Household Furnishings |
$480B | Goods |
 Sports Vehicles Sports Vehicles& Goods |
$636B | Goods |
 Clothing & Footwear Clothing & Footwear |
$510B | Goods |
 Gas Gas |
$467B | Goods |
 Other goods Other goods |
$1.8T | Goods |
 Total Total |
$18.8T | All |
Housing and utilities ($3.3T) and health care ($3.1T) were the top household expenditure categories overall.
Meanwhile, Americans spent the most money on groceries ($1.4T) in the goods category.
In case these numbers seem too big to comprehend, we’ve also broken down household expenditure by year and by month.
Comparative figures may vary as insurance expenditure can sometimes be included within a broader category (housing, transportation), or spun-off on its own.
In a similar vein, another graphic from eight years ago provides some other useful insights: how the share of each category’s expenditure has changed since the 1940s.
While the data isn’t as recent, other trends are visible: health care and housing expenditure have been trending up, clothing and food have been coming down.
The Pros and Cons of the Service Economy
Tellingly, services account for nearly 70% of America’s personal consumption expenditure.
This is matched by the supply side as well: nearly 80% of America’s jobs are in the service sector.
America’s transition away from manufacturing into services—both as producer and consumer—is a story with many episodes and arcs. While it has driven the growth of high-value technology and financial companies, it has also resulted in the loss of blue-collar jobs in America.
This context is particularly relevant in the Trump administration’s second-term.
Broad-based tariffs on imported goods have been declared to reduce trade deficits and to incentivize companies to move their manufacturing back into the country. However, modern manufacturing is built off global supply chains and just-in-time shipping, and economists worry that the disruption will only raise prices for Americans.
Learn More on the Voronoi App 
Wondering what China’s economy looks like broken down by sector? Check out: China’s $18.6 Trillion Economy in One Chart for a quick overview.

Keep your files stored safely and securely with the SanDisk 2TB Extreme Portable SSD. With over 69,505 ratings and an impressive 4.6 out of 5 stars, this product has been purchased over 8K+ times in the past month. At only $129.99, this Amazon’s Choice product is a must-have for secure file storage.
Help keep private content private with the included password protection featuring 256-bit AES hardware encryption. Order now for just $129.99 on Amazon!
Help Power Techcratic’s Future – Scan To Support
If Techcratic’s content and insights have helped you, consider giving back by supporting the platform with crypto. Every contribution makes a difference, whether it’s for high-quality content, server maintenance, or future updates. Techcratic is constantly evolving, and your support helps drive that progress.
As a solo operator who wears all the hats, creating content, managing the tech, and running the site, your support allows me to stay focused on delivering valuable resources. Your support keeps everything running smoothly and enables me to continue creating the content you love. I’m deeply grateful for your support, it truly means the world to me! Thank you!
|
BITCOIN
bc1qlszw7elx2qahjwvaryh0tkgg8y68enw30gpvge Scan the QR code with your crypto wallet app |
|
DOGECOIN
D64GwvvYQxFXYyan3oQCrmWfidf6T3JpBA Scan the QR code with your crypto wallet app |
|
ETHEREUM
0xe9BC980DF3d985730dA827996B43E4A62CCBAA7a Scan the QR code with your crypto wallet app |


Please read the Privacy and Security Disclaimer on how Techcratic handles your support.
Disclaimer: As an Amazon Associate, Techcratic may earn from qualifying purchases.


