


![[Download] Intuitive 3D Modeling | Abstract Sculpture | FLIGHT | DANA KRYSTLE](https://techcratic.com/wp-content/uploads/2025/08/1755630966_maxresdefault-360x180.jpg)


![[DEBUT COVER] Intergalactic Bound – Yunosuke / CircusP [MIKU EXPO 10th]](https://techcratic.com/wp-content/uploads/2025/08/1755598927_maxresdefault-360x180.jpg)


Pallavi Rao
2025-05-01 10:44:00
www.visualcapitalist.com
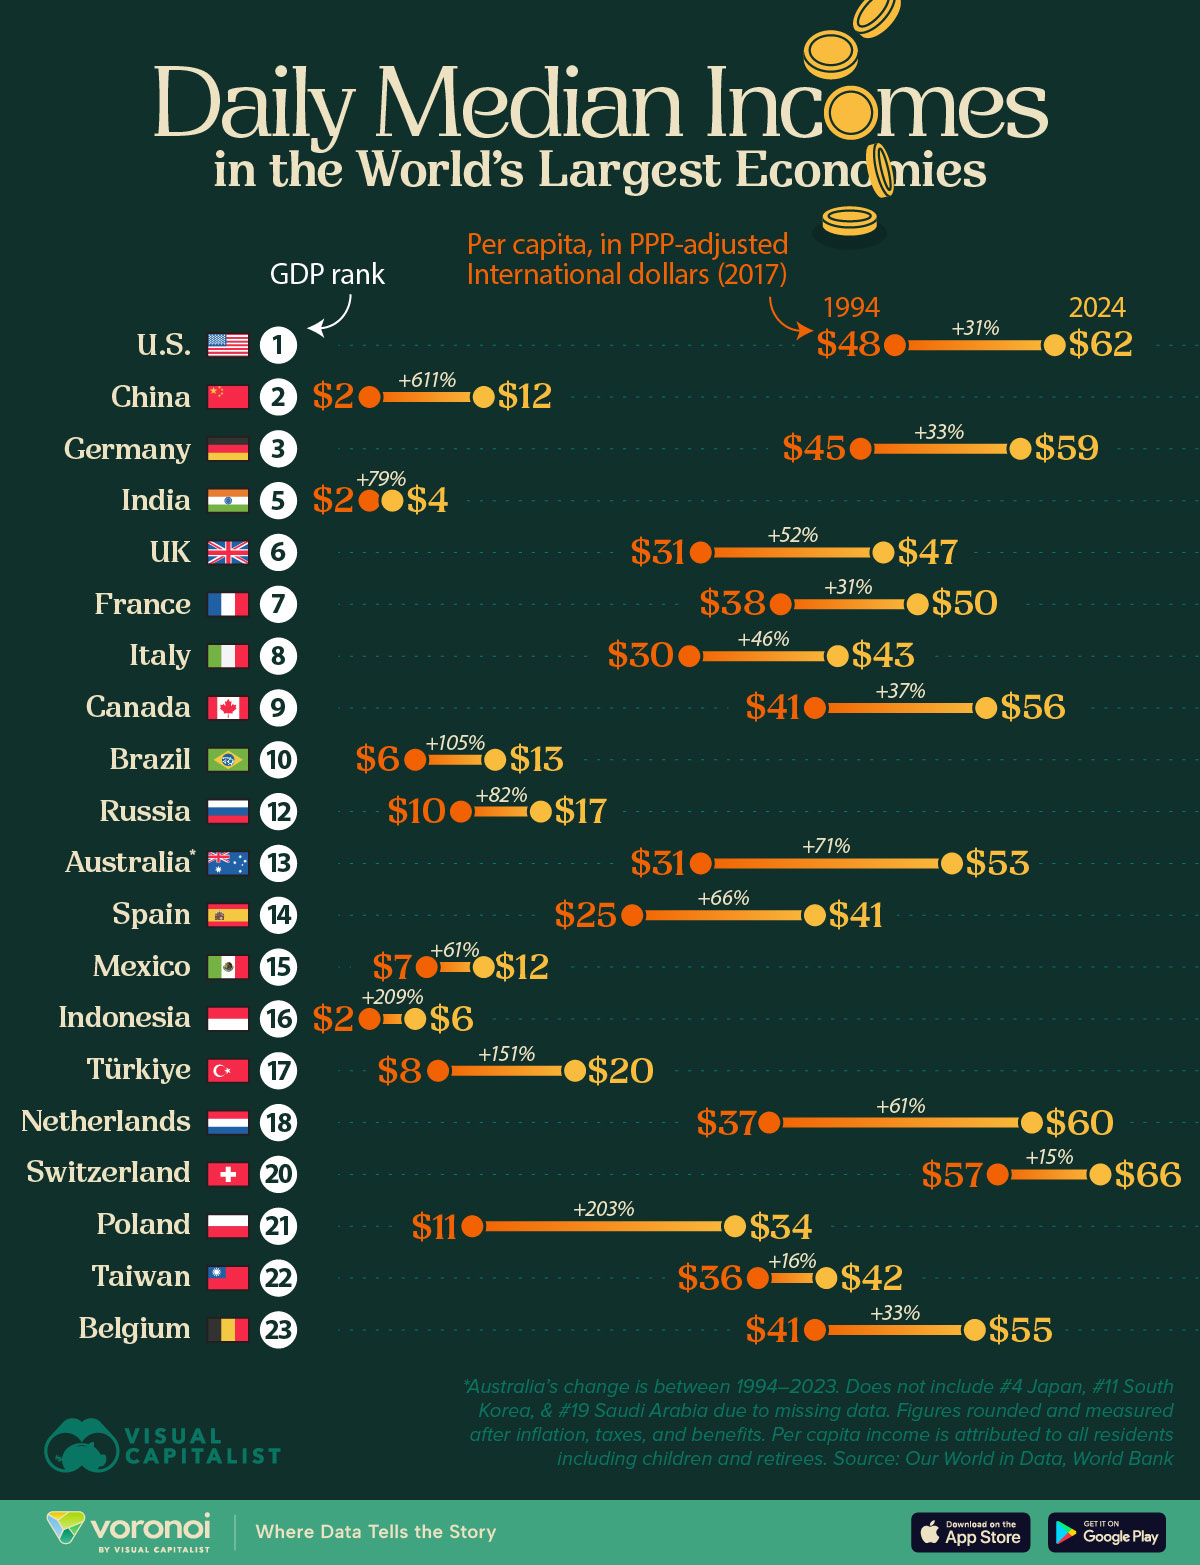
How Daily Incomes Have Changed in Top Economies (1994-2024)
This was originally posted on our Voronoi app. Download the app for free on iOS or Android and discover incredible data-driven charts from a variety of trusted sources.
Key Takeaways
- Daily average incomes in China have grown 6x between 1994–2024, after adjusting for inflation.
- In other developing countries (Indonesia, Poland, and Türkiye), incomes have tripled.
- In the U.S., the daily average income has gone up about 30% over the same period.
The mid-1990s feel like a different world. In the 30 years since, the global economy has shifted dramatically, across sectors and markets.
But headline stats like GDP, GDP per capita, or growth rates don’t always reflect what’s happening at the individual level.
So, has life actually improved over time?
To help answer that, we visualize figures from Our World in Data to show how daily median incomes have changed in 20 of the world’s largest economies from 1994 to 2024.
All figures are in PPP-adjusted International dollars per person. They are also adjusted for inflation, taxes, and benefits.
 PPP-adjusted International dollars reflect purchasing power by accounting for local prices and cost of living.
Important note: #4 Japan, #11 South Korea, and #19 Saudi Arabia are excluded due to missing data. Poland, Taiwan, and Belgium are included in their place.
Countries by GDP, Daily Median Incomes, and Income Growth
There’s two different takeaways from this chart. One is which top 20 economies have the highest average incomes in 2024.
The other is where incomes have grown the most. Use the toggles in the table below see the ranks by both metrics.
| GDP Rank | Country | 1994 | 2024 | % Change (1994–2024) |
|---|---|---|---|---|
| 1 |  U.S. U.S. |
$48 | $62 | 31 |
| 2 |  China China |
$2 | $12 | 611 |
| 3 |  Germany Germany |
$45 | $59 | 33 |
| 5 |  India India |
$2 | $4 | 79 |
| 6 |  UK UK |
$31 | $47 | 52 |
| 7 |  France France |
$38 | $50 | 31 |
| 8 |  Italy Italy |
$30 | $43 | 46 |
| 9 |  Canada Canada |
$41 | $56 | 37 |
| 10 |  Brazil Brazil |
$6 | $13 | 105 |
| 12 |  Russia Russia |
$10 | $17 | 82 |
| 13 |  Australia* Australia* |
$31 | $53 | 71 |
| 14 |  Spain Spain |
$25 | $41 | 66 |
| 15 |  Mexico Mexico |
$7 | $12 | 61 |
| 16 |  Indonesia Indonesia |
$2 | $6 | 209 |
| 17 |  Türkiye Türkiye |
$8 | $20 | 151 |
| 18 |  Netherlands Netherlands |
$37 | $60 | 61 |
| 20 |  Switzerland Switzerland |
$57 | $66 | 15 |
| 21 |  Poland Poland |
$11 | $34 | 203 |
| 22 |  Taiwan Taiwan |
$36 | $42 | 16 |
| 23 |  Belgium Belgium |
$41 | $55 | 33 |
Note: *Australia’s change is between 1994–2023 due to data restraints.
For example, incomes in China have grown 6x between 1994–2024, after adjusting for inflation. However in 2024 this still only amounted to $12 (international dollars) per person on average.
Per capita income is attributed to all residents including children and retirees. The median income could theoretically be between 2–4x for a working individual.In other developing countries (Indonesia, Poland, and Türkiye), daily incomes have tripled. Of these three Poland is the only one that’s moved from a low- to high-income country by 2024.
In the U.S., the daily average income has only gone up about 30% over the same period. But the country is second-richest in this dataset, after Switzerland.
How the U.S. Ranks in Income Growth vs. Peer Countries
Interestingly, the U.S. has the least median income growth versus peers like Germany, UK, and France.
In other social metrics, the U.S. is lagging its counterparts. Its life expectancy is a full four years below its high-income counterparts.
And this despite having the highest health expenditure in a similar group.
It also has one of the highest inequality scores amongst its peers.
Learn More on the Voronoi App 
While a lot of American media is focused on income and wealth inequality, U.S. incomes far outpace many other countries. Check out: Ranked: Daily Incomes of the Richest & Poorest in 25 Countries to see how much richer even the bottom 10% Americans are.

Keep your files stored safely and securely with the SanDisk 2TB Extreme Portable SSD. With over 69,505 ratings and an impressive 4.6 out of 5 stars, this product has been purchased over 8K+ times in the past month. At only $129.99, this Amazon’s Choice product is a must-have for secure file storage.
Help keep private content private with the included password protection featuring 256-bit AES hardware encryption. Order now for just $129.99 on Amazon!
Help Power Techcratic’s Future – Scan To Support
If Techcratic’s content and insights have helped you, consider giving back by supporting the platform with crypto. Every contribution makes a difference, whether it’s for high-quality content, server maintenance, or future updates. Techcratic is constantly evolving, and your support helps drive that progress.
As a solo operator who wears all the hats, creating content, managing the tech, and running the site, your support allows me to stay focused on delivering valuable resources. Your support keeps everything running smoothly and enables me to continue creating the content you love. I’m deeply grateful for your support, it truly means the world to me! Thank you!
|
BITCOIN
bc1qlszw7elx2qahjwvaryh0tkgg8y68enw30gpvge Scan the QR code with your crypto wallet app |
|
DOGECOIN
D64GwvvYQxFXYyan3oQCrmWfidf6T3JpBA Scan the QR code with your crypto wallet app |
|
ETHEREUM
0xe9BC980DF3d985730dA827996B43E4A62CCBAA7a Scan the QR code with your crypto wallet app |


Please read the Privacy and Security Disclaimer on how Techcratic handles your support.
Disclaimer: As an Amazon Associate, Techcratic may earn from qualifying purchases.


