


![for 2025 Tesla Model 3 Rear Back Seat Protector [Durable Upgraded TPE] Second Row Seats…](https://techcratic.com/wp-content/uploads/2025/08/81by5xZys1L._AC_SL1500_-360x180.jpg)


![Serenity [Blu-ray]](https://techcratic.com/wp-content/uploads/2025/08/815I563v-LL._SL1500_-360x180.jpg)


Pallavi Rao
2025-05-22 10:33:00
www.visualcapitalist.com
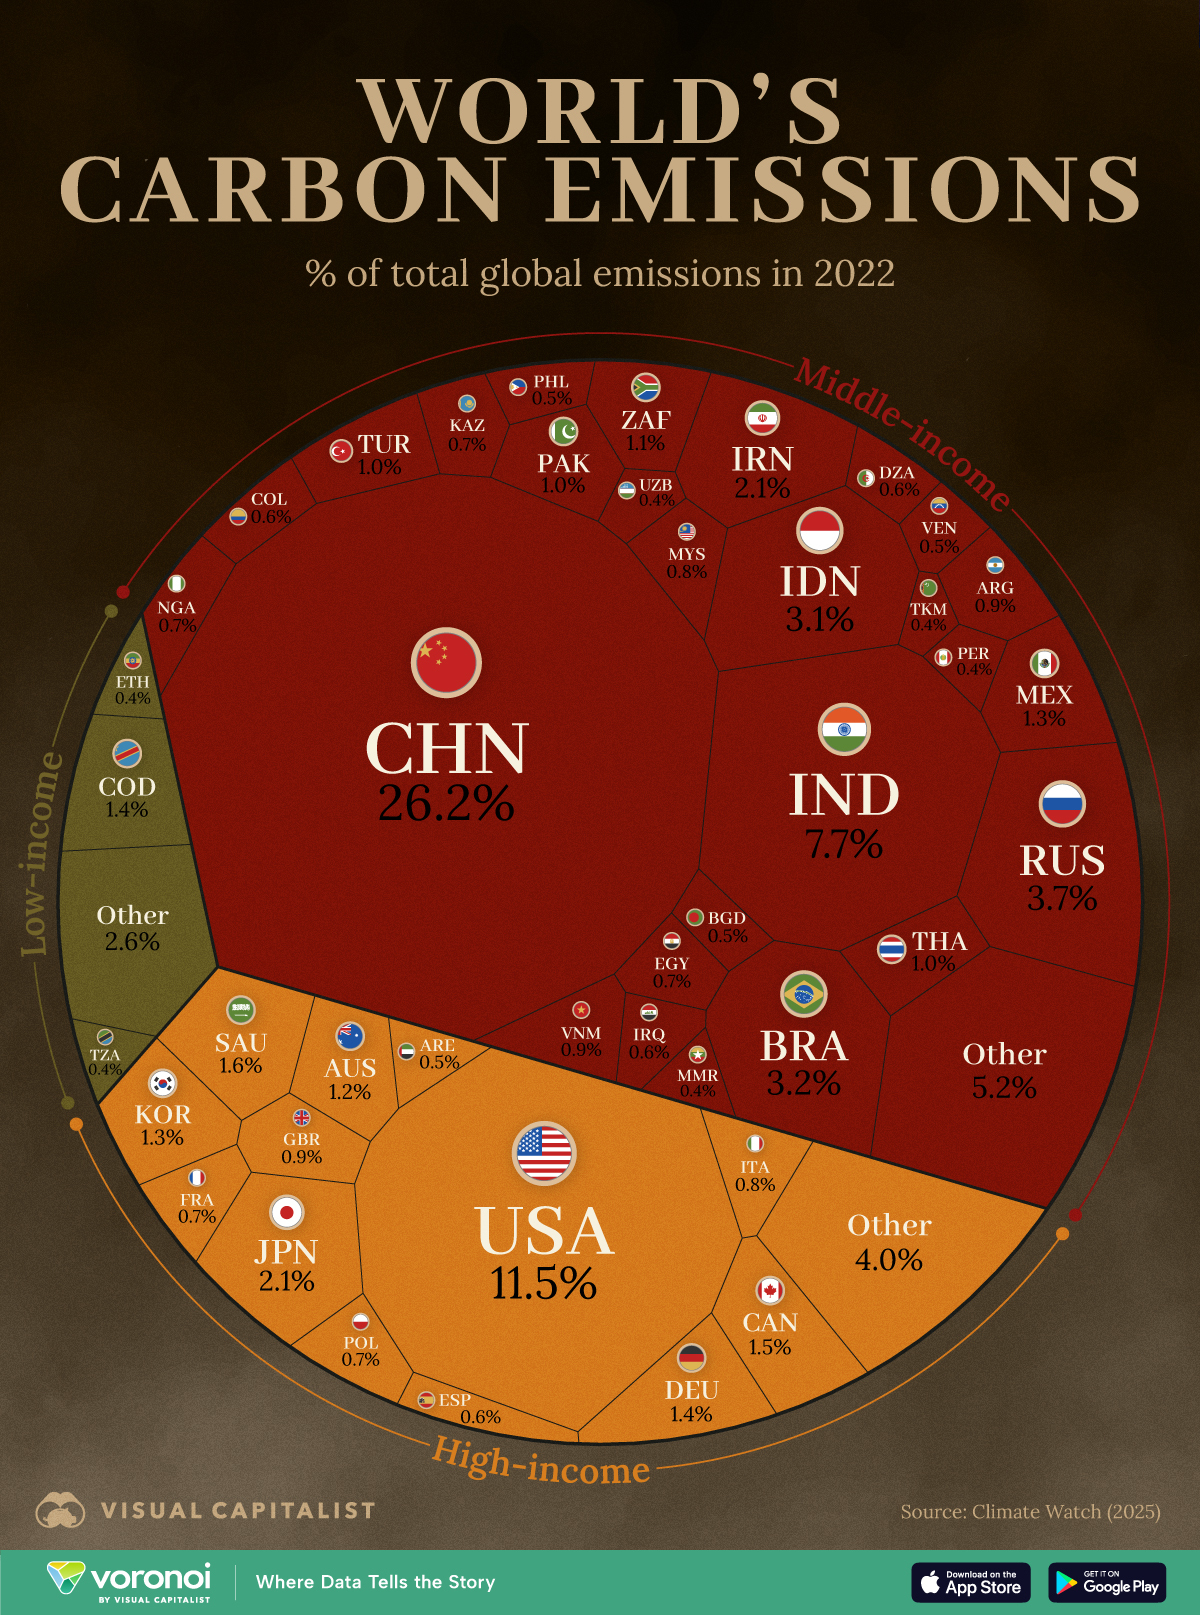
Visualized: Share of World Carbon Emissions by Country
This was originally posted on our Voronoi app. Download the app for free on iOS or Android and discover incredible data-driven charts from a variety of trusted sources.
Key Takeaways
- China accounts for 26.2% of world carbon emissions, while the U.S. is responsible for another 11.5%.
- This was equivalent to 12.7 billion tons of carbon dioxide for China and 5.6 billion tCO2e for the U.S. in 2022.
- Most of the top 10 emitters are also the world’s most populous countries, barring Iran, Saudi Arabia, and Canada.
This graphic breaks down the share of global carbon emissions by country, categorized into income groups.
Countries with a share below 0.4% are combined into the “other” group in each income category.
Data for this chart is sourced from Climate Watch for the year 2022—the latest available figures. Income group categorization uses the current World Bank classification system.
 Income group classification is based off gross national income (GNI) per capita data in U.S. dollars, converted from local currencies. Upper and lower middle-income groups have been combined into one for this graphic.
Share of World Carbon Emissions by Country in 2022
Ranked first, China accounts for 26% of all global emissions, measured at 12.7 billion tCO2e in 2022. For reference, China has a population of 1.4 billion people.
| Rank | Country | ISO Code | Share of Total Emissions |
Carbon Emissions (in million tCO2e, 2022) |
|---|---|---|---|---|
| 1 |  China China |
CHN | 26.16% | 12,716 |
| 2 |  U.S. U.S. |
USA | 11.53% | 5,604 |
| 3 |  India India |
IND | 7.69% | 3,737 |
| 4 |  Russia Russia |
RUS | 3.75% | 1,821 |
| 5 |  Brazil Brazil |
BRA | 3.16% | 1,538 |
| 6 |  Indonesia Indonesia |
IDN | 3.15% | 1,530 |
| 7 |  Japan Japan |
JPN | 2.15% | 1,044 |
| 8 |  Iran Iran |
IRN | 2.06% | 1,004 |
| 9 |  Saudi Arabia Saudi Arabia |
SAU | 1.60% | 775 |
| 10 |  Canada Canada |
CAN | 1.54% | 750 |
| 11 |  DRC DRC |
COD | 1.44% | 700 |
| 12 |  Germany Germany |
DEU | 1.43% | 696 |
| 13 |  Mexico Mexico |
MEX | 1.31% | 637 |
| 14 |  South Korea South Korea |
KOR | 1.29% | 627 |
| 15 |  Australia Australia |
AUS | 1.18% | 574 |
| 16 |  South Africa South Africa |
ZAF | 1.09% | 530 |
| 17 |  Pakistan Pakistan |
PAK | 1.04% | 505 |
| 18 |  Türkiye Türkiye |
TUR | 1.02% | 497 |
| 19 |  Thailand Thailand |
THA | 0.96% | 466 |
| 20 |  Vietnam Vietnam |
VNM | 0.93% | 454 |
| 21 |  Argentina Argentina |
ARG | 0.88% | 429 |
| 22 |  UK UK |
GBR | 0.85% | 414 |
| 23 |  Malaysia Malaysia |
MYS | 0.80% | 387 |
| 24 |  Italy Italy |
ITA | 0.76% | 370 |
| 25 |  Nigeria Nigeria |
NGA | 0.73% | 356 |
| 26 |  Poland Poland |
POL | 0.72% | 348 |
| 27 |  Egypt Egypt |
EGY | 0.69% | 336 |
| 28 |  France France |
FRA | 0.68% | 330 |
| 29 |  Kazakhstan Kazakhstan |
KAZ | 0.68% | 328 |
| 30 |  Iraq Iraq |
IRQ | 0.63% | 305 |
| 31 |  Algeria Algeria |
DZA | 0.60% | 293 |
| 32 |  Colombia Colombia |
COL | 0.57% | 279 |
| 33 |  Spain Spain |
ESP | 0.57% | 275 |
| 34 |  Venezuela Venezuela |
VEN | 0.54% | 264 |
| 35 |  Bangladesh Bangladesh |
BGD | 0.52% | 255 |
| 36 |  UAE UAE |
ARE | 0.52% | 253 |
| 37 |  Philippines Philippines |
PHL | 0.51% | 247 |
| 38 |  Turkmenistan Turkmenistan |
TKM | 0.44% | 215 |
| 39 |  Myanmar Myanmar |
MMR | 0.43% | 209 |
| 40 |  Ethiopia Ethiopia |
ETH | 0.43% | 209 |
| 41 |  Peru Peru |
PER | 0.41% | 199 |
| 42 |  Uzbekistan Uzbekistan |
UZB | 0.38% | 187 |
| 43 |  Tanzania Tanzania |
TZA | 0.36% | 176 |
| 44 |  Ukraine Ukraine |
UKR | 0.35% | 169 |
| 45 |  Netherlands Netherlands |
NLD | 0.31% | 153 |
| 46 |  Kuwait Kuwait |
KWT | 0.31% | 149 |
| 47 |  Bolivia Bolivia |
BOL | 0.28% | 136 |
| 48 |  Angola Angola |
AGO | 0.27% | 134 |
| 49 |  Cameroon Cameroon |
CMR | 0.27% | 131 |
| 50 |  Sudan Sudan |
SDN | 0.26% | 128 |
| 51 |  Qatar Qatar |
QAT | 0.25% | 122 |
| 52 |  Chad Chad |
TCD | 0.25% | 119 |
| 53 |  Zimbabwe Zimbabwe |
ZWE | 0.24% | 117 |
| 54 |  Mozambique Mozambique |
MOZ | 0.24% | 115 |
| 55 |  Czech Republic Czech Republic |
CZE | 0.22% | 106 |
| 56 |  Oman Oman |
OMN | 0.22% | 106 |
| 57 |  Ecuador Ecuador |
ECU | 0.21% | 103 |
| 58 |  Libya Libya |
LBY | 0.21% | 102 |
| 59 |  Zambia Zambia |
ZMB | 0.20% | 96 |
| 60 |  Paraguay Paraguay |
PRY | 0.20% | 95 |
| 61 |  Belgium Belgium |
BEL | 0.19% | 95 |
| 62 |  Morocco Morocco |
MAR | 0.19% | 92 |
| 63 |  Israel Israel |
ISR | 0.18% | 89 |
| 64 |  North Korea North Korea |
PRK | 0.18% | 87 |
| 65 |  Belarus Belarus |
BLR | 0.17% | 84 |
| 66 |  Mongolia Mongolia |
MNG | 0.17% | 82 |
| 67 |  Kenya Kenya |
KEN | 0.17% | 81 |
| 68 |  Cambodia Cambodia |
KHM | 0.16% | 77 |
| 69 |  Romania Romania |
ROU | 0.16% | 77 |
| 70 |  Greece Greece |
GRC | 0.15% | 72 |
| 71 |  Singapore Singapore |
SGP | 0.14% | 70 |
| 72 |  New Zealand New Zealand |
NZL | 0.14% | 68 |
| 73 |  Ireland Ireland |
IRL | 0.14% | 67 |
| 74 |  South Sudan South Sudan |
SSD | 0.13% | 64 |
| 75 |  Austria Austria |
AUT | 0.13% | 63 |
| 76 |  Serbia Serbia |
SRB | 0.13% | 63 |
| 77 |  Uganda Uganda |
UGA | 0.13% | 61 |
| 78 |  Côte d’Ivoire Côte d’Ivoire |
CIV | 0.12% | 61 |
| 79 |  Finland Finland |
FIN | 0.12% | 60 |
| 80 |  Botswana Botswana |
BWA | 0.12% | 60 |
| 81 |  Burkina Faso Burkina Faso |
BFA | 0.12% | 59 |
| 82 |  Hungary Hungary |
HUN | 0.12% | 59 |
| 83 |  Syria Syria |
SYR | 0.12% | 58 |
| 84 |  Central CentralAfrican Republic |
CAF | 0.12% | 58 |
| 85 |  Azerbaijan Azerbaijan |
AZE | 0.12% | 57 |
| 86 |  Bahrain Bahrain |
BHR | 0.12% | 57 |
| 87 |  Papua PapuaNew Guinea |
PNG | 0.11% | 55 |
| 88 |  Portugal Portugal |
PRT | 0.11% | 54 |
| 89 |  Nepal Nepal |
NPL | 0.11% | 53 |
| 90 |  Niger Niger |
NER | 0.11% | 53 |
| 91 |  Chile Chile |
CHL | 0.11% | 52 |
| 92 |  Mali Mali |
MLI | 0.10% | 47 |
| 93 |  Solomon Islands Solomon Islands |
SLB | 0.10% | 46 |
| 94 |  Dominican Republic Dominican Republic |
DOM | 0.09% | 45 |
| 95 |  Laos Laos |
LAO | 0.09% | 45 |
| 96 |  Madagascar Madagascar |
MDG | 0.09% | 43 |
| 97 |  Somalia Somalia |
SOM | 0.09% | 43 |
| 98 |  Guatemala Guatemala |
GTM | 0.09% | 43 |
| 99 |  Guinea Guinea |
GIN | 0.09% | 43 |
| 100 |  Denmark Denmark |
DNK | 0.09% | 43 |
| 101 |  Switzerland Switzerland |
CHE | 0.08% | 41 |
| 102 |  Nicaragua Nicaragua |
NIC | 0.08% | 40 |
| 103 |  Senegal Senegal |
SEN | 0.08% | 39 |
| 104 |  Tunisia Tunisia |
TUN | 0.08% | 39 |
| 105 |  Sri Lanka Sri Lanka |
LKA | 0.08% | 36 |
| 106 |  Uruguay Uruguay |
URY | 0.07% | 36 |
| 107 |  Jordan Jordan |
JOR | 0.07% | 36 |
| 108 |  Slovakia Slovakia |
SVK | 0.07% | 35 |
| 109 |  Sweden Sweden |
SWE | 0.07% | 34 |
| 110 |  Afghanistan Afghanistan |
AFG | 0.07% | 33 |
| 111 |  Norway Norway |
NOR | 0.06% | 32 |
| 112 |  Congo Congo |
COG | 0.06% | 31 |
| 113 |  Cuba Cuba |
CUB | 0.06% | 30 |
| 114 |  Honduras Honduras |
HND | 0.06% | 29 |
| 115 |  Yemen Yemen |
YEM | 0.06% | 28 |
| 116 |  Benin Benin |
BEN | 0.05% | 26 |
| 117 |  Trinidad Trinidad& Tobago |
TTO | 0.05% | 24 |
| 118 |  Bosnia & Bosnia &Herzegovina |
BIH | 0.05% | 24 |
| 119 |  Panama Panama |
PAN | 0.05% | 24 |
| 120 |  Lithuania Lithuania |
LTU | 0.05% | 24 |
| 121 |  Namibia Namibia |
NAM | 0.05% | 22 |
| 122 |  Gabon Gabon |
GAB | 0.04% | 22 |
| 123 |  Malawi Malawi |
MWI | 0.04% | 21 |
| 124 |  Bulgaria Bulgaria |
BGR | 0.04% | 20 |
| 125 |  Guyana Guyana |
GUY | 0.04% | 20 |
| 126 |  Georgia Georgia |
GEO | 0.04% | 19 |
| 127 |  Tajikistan Tajikistan |
TJK | 0.04% | 19 |
| 128 |  Lebanon Lebanon |
LBN | 0.04% | 18 |
| 129 |  Croatia Croatia |
HRV | 0.04% | 18 |
| 130 |  Ghana Ghana |
GHA | 0.04% | 18 |
| 131 |  Estonia Estonia |
EST | 0.04% | 18 |
| 132 |  Slovenia Slovenia |
SVN | 0.03% | 16 |
| 133 |  Liberia Liberia |
LBR | 0.03% | 15 |
| 134 |  El Salvador El Salvador |
SLV | 0.03% | 14 |
| 135 |  Kyrgyzstan Kyrgyzstan |
KGZ | 0.03% | 14 |
| 136 |  Mauritania Mauritania |
MRT | 0.03% | 14 |
| 137 |  Suriname Suriname |
SUR | 0.03% | 14 |
| 138 |  Moldova Moldova |
MDA | 0.03% | 13 |
| 139 |  Equatorial Guinea Equatorial Guinea |
GNQ | 0.02% | 12 |
| 140 |  Haiti Haiti |
HTI | 0.02% | 12 |
| 141 |  Brunei Brunei |
BRN | 0.02% | 12 |
| 142 |  Latvia Latvia |
LVA | 0.02% | 11 |
| 143 |  Armenia Armenia |
ARM | 0.02% | 11 |
| 144 |  Togo Togo |
TGO | 0.02% | 11 |
| 145 |  North Macedonia North Macedonia |
MKD | 0.02% | 10 |
| 146 |  Sierra Leone Sierra Leone |
SLE | 0.02% | 10 |
| 147 |  Rwanda Rwanda |
RWA | 0.02% | 10 |
| 148 |  Jamaica Jamaica |
JAM | 0.02% | 9 |
| 149 |  Costa Rica Costa Rica |
CRI | 0.02% | 9 |
| 150 |  Cyprus Cyprus |
CYP | 0.02% | 8 |
| 151 |  Burundi Burundi |
BDI | 0.02% | 8 |
| 152 |  Albania Albania |
ALB | 0.02% | 8 |
| 153 |  Luxembourg Luxembourg |
LUX | 0.02% | 8 |
| 154 |  Eritrea Eritrea |
ERI | 0.01% | 7 |
| 155 |  Mauritius Mauritius |
MUS | 0.01% | 7 |
| 156 |  Belize Belize |
BLZ | 0.01% | 7 |
| 157 |  East Timor East Timor |
TLS | 0.01% | 6 |
| 158 |  Guinea-Bissau Guinea-Bissau |
GNB | 0.01% | 4 |
| 159 |  Lesotho Lesotho |
LSO | 0.01% | 4 |
| 160 |  Montenegro Montenegro |
MNE | 0.01% | 4 |
| 161 |  Barbados Barbados |
BRB | 0.01% | 4 |
| 162 |  Iceland Iceland |
ISL | 0.01% | 3 |
| 163 |  Eswatini Eswatini |
SWZ | 0.01% | 3 |
| 164 |  Bahamas Bahamas |
BHS | 0.01% | 3 |
| 165 |  Gambia Gambia |
GMB | 0.01% | 3 |
| 166 |  Maldives Maldives |
MDV | 0.01% | 3 |
| 167 |  Grenada Grenada |
GRD | 0.00% | 2 |
| 168 |  Malta Malta |
MLT | 0.00% | 2 |
| 169 |  Djibouti Djibouti |
DJI | 0.00% | 2 |
| 170 |  Antigua Antigua& Barbuda |
ATG | 0.00% | 2 |
| 171 |  Seychelles Seychelles |
SYC | 0.00% | 1 |
| 172 |  Saint Lucia Saint Lucia |
LCA | 0.00% | 1 |
| 173 |  Bhutan Bhutan |
BTN | 0.00% | 1 |
| 174 |  Comoros Comoros |
COM | 0.00% | 1 |
| 175 |  Cabo Verde Cabo Verde |
CPV | 0.00% | 1 |
| 176 |  Vanuatu Vanuatu |
VUT | 0.00% | 1 |
| 177 |  Samoa Samoa |
WSM | 0.00% | 1 |
| 178 |  Andorra Andorra |
AND | 0.00% | 1 |
| 179 |  São Tomé São Tomé& Principe |
STP | 0.00% | 0.4 |
| 180 |  Saint Kitts Saint Kitts& Nevis |
KNA | 0.00% | 0.4 |
| 181 |  Saint Vincent Saint Vincent& the Grenadines |
VCT | 0.00% | 0.3 |
| 182 |  Tonga Tonga |
TON | 0.00% | 0.3 |
| 183 |  Palau Palau |
PLW | 0.00% | 0.2 |
| 184 |  Dominica Dominica |
DMA | 0.00% | 0.2 |
| 185 |  Marshall Islands Marshall Islands |
MHL | 0.00% | 0.2 |
| 186 |  Micronesia Micronesia |
FSM | 0.00% | 0.2 |
| 187 |  Liechtenstein Liechtenstein |
LIE | 0.00% | 0.2 |
| 188 |  Kiribati Kiribati |
KIR | 0.00% | 0.1 |
| 189 |  Cook Islands Cook Islands |
COK | 0.00% | 0.1 |
| 190 |  Nauru Nauru |
NRU | 0.00% | 0.1 |
| 191 |  Tuvalu Tuvalu |
TUV | 0.00% | 0.02 |
| 192 |  Niue Niue |
NIU | 0.00% | 0.01 |
| N/A |  World World |
N/A | N/A | 48,612 |
Meanwhile, at second place, the U.S. is responsible for another 11.5% of all emissions, with a population of 333 million people.
The two countries together account for 38% of the entire world’s emissions. This is slightly less than their share of the world economy (43%) and a lot less than their share of the world’s population (22%).
On a per capita basis, the U.S. produces almost double the emissions per person (14 tCO2e) compared to China (8 tCO2e).
Most of the top 10 emitters are also the world’s most populous countries, barring Iran, Saudi Arabia, and Canada.
Developing Countries Are Driving Emissions Growth
Another obvious takeaway from the chart is how middle-income countries are responsible for the largest share of emissions.
Before we can go into the why, there is also some simple arithmetic at play. For one, more countries are in the middle-income distribution than high- or low-income categories.
And many of these middle-income countries have large, growing populations, which increases aggregate emissions.
However, it is also true that they are driving global carbon emissions growth. And this is because:
- They are prioritizing economic development, leading to an overall increase in energy consumption (and related emissions).
- Most emissions-heavy industries and manufacturing plants have moved from high-income countries to middle- and low-income ones.
- Thus, high-income countries are able to sustain their consumption levels while the emissions from producing the goods they consume are accounted for elsewhere.
This last point is particularly crucial when it comes to emissions math. In fact, when accounting for these consumption-based emissions on a per capita basis, high-income countries are still responsible for a significant part of global carbon emissions.
Learn More on the Voronoi App 
Wondering what the same chart looks like, but with an economic lens? Check out: World’s Carbon Emissions by Sector for a similar breakdown.

Keep your files stored safely and securely with the SanDisk 2TB Extreme Portable SSD. With over 69,505 ratings and an impressive 4.6 out of 5 stars, this product has been purchased over 8K+ times in the past month. At only $129.99, this Amazon’s Choice product is a must-have for secure file storage.
Help keep private content private with the included password protection featuring 256-bit AES hardware encryption. Order now for just $129.99 on Amazon!
Help Power Techcratic’s Future – Scan To Support
If Techcratic’s content and insights have helped you, consider giving back by supporting the platform with crypto. Every contribution makes a difference, whether it’s for high-quality content, server maintenance, or future updates. Techcratic is constantly evolving, and your support helps drive that progress.
As a solo operator who wears all the hats, creating content, managing the tech, and running the site, your support allows me to stay focused on delivering valuable resources. Your support keeps everything running smoothly and enables me to continue creating the content you love. I’m deeply grateful for your support, it truly means the world to me! Thank you!
|
BITCOIN
bc1qlszw7elx2qahjwvaryh0tkgg8y68enw30gpvge Scan the QR code with your crypto wallet app |
|
DOGECOIN
D64GwvvYQxFXYyan3oQCrmWfidf6T3JpBA Scan the QR code with your crypto wallet app |
|
ETHEREUM
0xe9BC980DF3d985730dA827996B43E4A62CCBAA7a Scan the QR code with your crypto wallet app |


Please read the Privacy and Security Disclaimer on how Techcratic handles your support.
Disclaimer: As an Amazon Associate, Techcratic may earn from qualifying purchases.


