


![[Download] Intuitive 3D Modeling | Abstract Sculpture | FLIGHT | DANA KRYSTLE](https://techcratic.com/wp-content/uploads/2025/08/1755630966_maxresdefault-360x180.jpg)


Pallavi Rao
2025-06-05 08:11:00
www.visualcapitalist.com
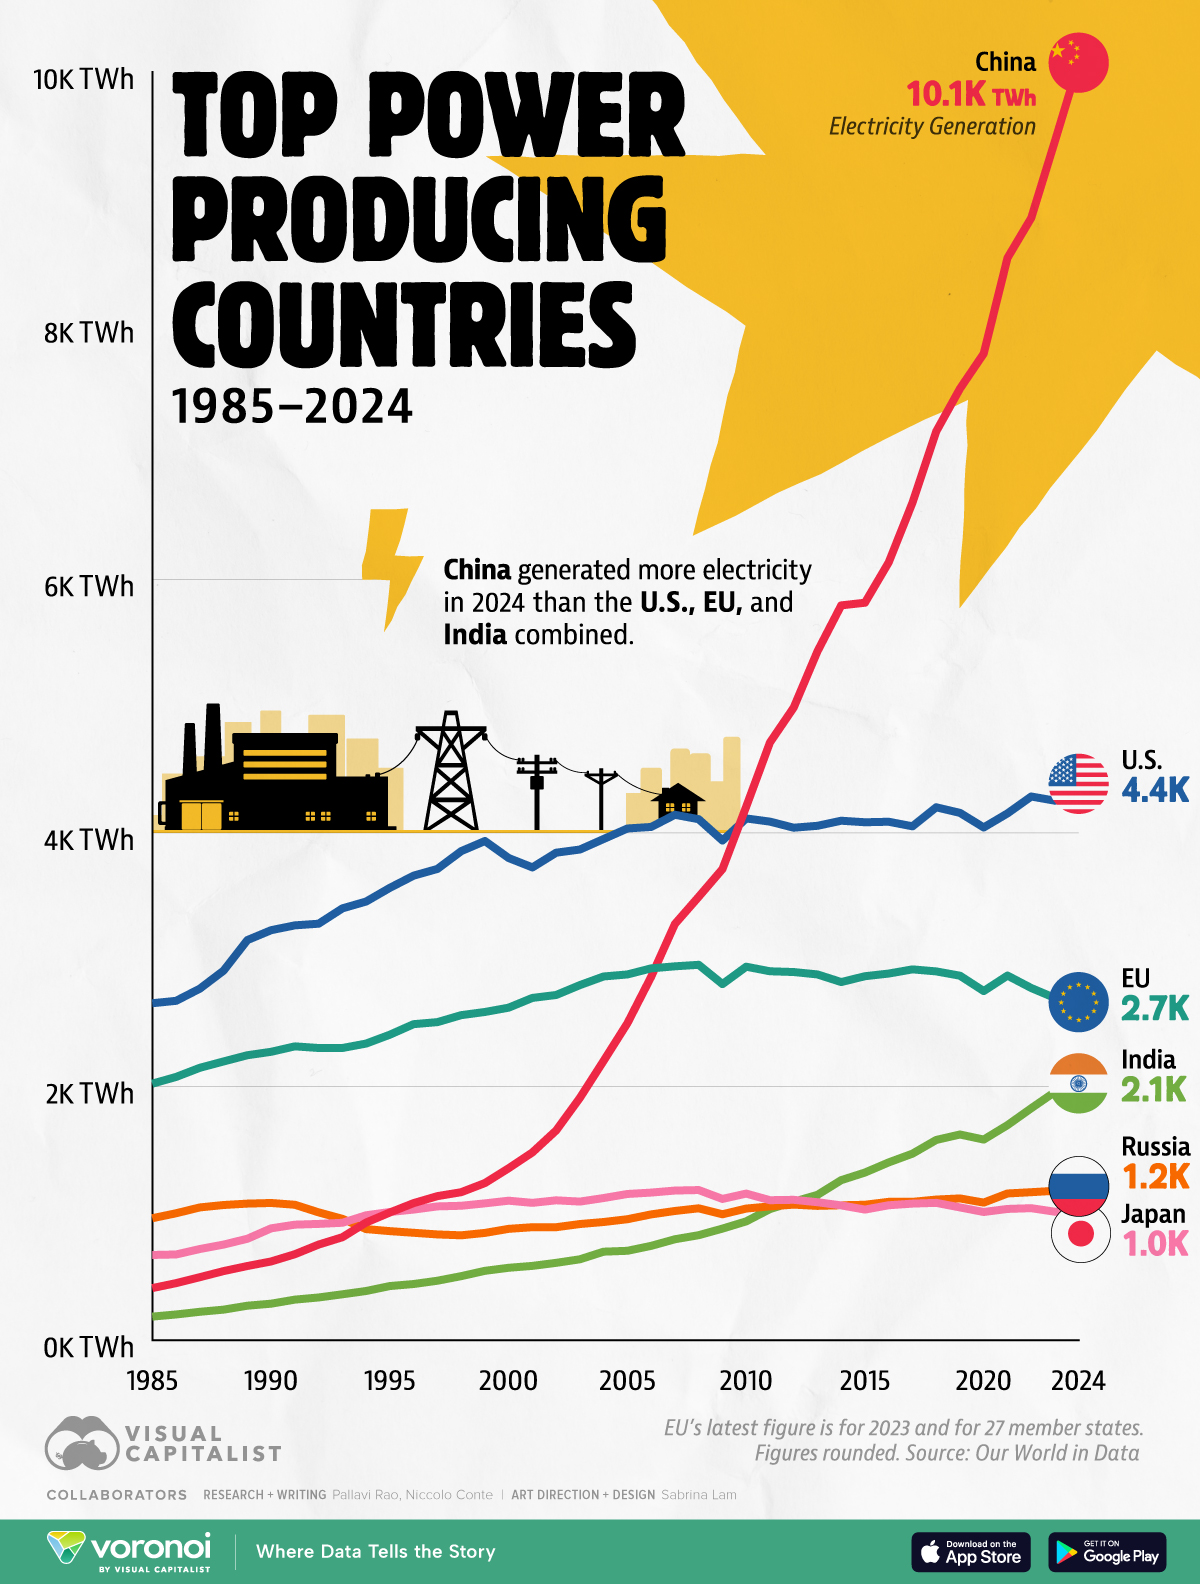
Ranked: Top Countries by Annual Electricity Production
This was originally posted on our Voronoi app. Download the app for free on iOS or Android and discover incredible data-driven charts from a variety of trusted sources.
Key Takeaways
- China tops the list for electricity production in 2024.
- The world’s second-largest economy produced over 10,000 TWh of electricity.
- That’s more than the combined output of the U.S., EU, and India—the next three biggest producers.
A light bulb is a symbol for innovation, ingenuity, and progress.
While it lends itself well as a visual metaphor for “bright idea,” the electricity powering it is also fundamental to the functioning of modern economies.
Which is why when we visualize the top countries by annual electricity production between 1985–2024, the world’s largest economies are the ones that show up on the chart.
Figures for this graphic are sourced from Our World in Data, measured in terawatt-hours (TWh)
Ranked: The Largest Electricity Producers in the World
China generated over 10,000 TWh of electricity in 2024.
For context, that’s more than the combined output of the U.S., EU, and India—the next three biggest producers.
| Year |  China (TWh) China (TWh) |
 U.S. U.S. |
 EU EU |
 India India |
 Russia Russia |
 Japan Japan |
|---|---|---|---|---|---|---|
| 1985 | 411 | 2,657 | 2,023 | 186 | 962 | 672 |
| 1986 | 450 | 2,676 | 2,076 | 203 | 1,001 | 676 |
| 1987 | 497 | 2,772 | 2,148 | 224 | 1,047 | 719 |
| 1988 | 545 | 2,914 | 2,198 | 241 | 1,066 | 754 |
| 1989 | 585 | 3,155 | 2,247 | 272 | 1,077 | 800 |
| 1990 | 621 | 3,233 | 2,274 | 288 | 1,082 | 882 |
| 1991 | 678 | 3,271 | 2,317 | 320 | 1,068 | 911 |
| 1992 | 754 | 3,284 | 2,304 | 337 | 1,008 | 917 |
| 1993 | 812 | 3,405 | 2,304 | 362 | 957 | 926 |
| 1994 | 928 | 3,459 | 2,339 | 388 | 876 | 985 |
| 1995 | 1,007 | 3,567 | 2,409 | 427 | 860 | 1,011 |
| 1996 | 1,081 | 3,663 | 2,492 | 443 | 847 | 1,030 |
| 1997 | 1,136 | 3,716 | 2,508 | 469 | 834 | 1,055 |
| 1998 | 1,167 | 3,856 | 2,563 | 505 | 827 | 1,060 |
| 1999 | 1,239 | 3,936 | 2,588 | 547 | 846 | 1,079 |
| 2000 | 1,356 | 3,802 | 2,622 | 571 | 878 | 1,100 |
| 2001 | 1,481 | 3,728 | 2,699 | 586 | 891 | 1,083 |
| 2002 | 1,654 | 3,844 | 2,722 | 610 | 891 | 1,103 |
| 2003 | 1,911 | 3,869 | 2,800 | 638 | 916 | 1,093 |
| 2004 | 2,203 | 3,952 | 2,868 | 698 | 932 | 1,121 |
| 2005 | 2,500 | 4,035 | 2,884 | 705 | 954 | 1,153 |
| 2006 | 2,866 | 4,047 | 2,932 | 744 | 992 | 1,164 |
| 2007 | 3,282 | 4,143 | 2,948 | 796 | 1,019 | 1,180 |
| 2008 | 3,496 | 4,108 | 2,960 | 828 | 1,040 | 1,184 |
| 2009 | 3,715 | 3,940 | 2,808 | 880 | 993 | 1,114 |
| 2010 | 4,207 | 4,114 | 2,945 | 937 | 1,038 | 1,156 |
| 2011 | 4,713 | 4,089 | 2,909 | 1,034 | 1,055 | 1,104 |
| 2012 | 4,988 | 4,041 | 2,903 | 1,092 | 1,069 | 1,107 |
| 2013 | 5,432 | 4,056 | 2,884 | 1,146 | 1,059 | 1,088 |
| 2014 | 5,794 | 4,096 | 2,824 | 1,262 | 1,064 | 1,063 |
| 2015 | 5,815 | 4,084 | 2,870 | 1,322 | 1,068 | 1,030 |
| 2016 | 6,133 | 4,088 | 2,891 | 1,402 | 1,091 | 1,064 |
| 2017 | 6,604 | 4,052 | 2,924 | 1,471 | 1,091 | 1,077 |
| 2018 | 7,166 | 4,202 | 2,908 | 1,579 | 1,109 | 1,083 |
| 2019 | 7,503 | 4,158 | 2,874 | 1,622 | 1,118 | 1,047 |
| 2020 | 7,779 | 4,043 | 2,753 | 1,582 | 1,085 | 1,011 |
| 2021 | 8,534 | 4,154 | 2,875 | 1,696 | 1,157 | 1,035 |
| 2022 | 8,849 | 4,287 | 2,777 | 1,829 | 1,167 | 1,041 |
| 2023 | 9,456 | 4,254 | 2,698 | 1,958 | 1,178 | 1,013 |
| 2024 | 10,073 | 4,387 | 2,698 | 2,058 | 1,211 | 1,022 |
Note: EU’s latest figure is from 2023.
China’s rapid rise in electricity generation fueled its equally rapid economic growth. In fact, research found that 1% increase in its electricity production corresponded to 0.17% increase in GDP (but not vice-versa).
However, in 2015 the Chinese government mandated a dual control policy to power generation. This meant reducing energy intensity by forcing shutdowns along with developing renewable sources to curb their emissions.
For reference, China also produces the most wind and solar energy in the world.
Why China Generates & Consumes More Electricity Than U.S.
If electricity generation (and consumption) correspond so closely to economic growth, then why is China still the second-largest economy in the world when it’s far outpaced the U.S. in power production?
The answer lies in how electricity is consumed in each country. Data from the IEA shows that industry is the primary consumer for China’s electricity.
| Country | Main Consumption Sector | Share of Total Electricity Use |
|---|---|---|
| China |
Industry | 59% |
| U.S. |
Residential | 38% |
Source: IEA: China’s electricity profile and the U.S. electricity profile.
On the other hand, America’s primary electricity consumers are residential homes.
A quick reminder that over the last two decades, manufacturing and heavy industries (with the exception of oil and gas production) have moved to China from the rest of the world, driving its extraordinary economic growth.
Meanwhile, the U.S. economy is powered by consumption of goods and high-value services, both which aren’t as energy-intensive as manufacturing.
Thus, China needs more to power itself because of its economic structure, and not only because it has more people.
Finally, the emergence of AI, and the demand for data centers means that U.S. electricity consumption (and generation), which has been steady for the last 20 years, is ticking up again.
Learn More on the Voronoi App 
This chart is best viewed with other data in context. Check out: Visualizing China’s 18.6 Trillion Economy by Sector to see how much industry contributes to the country’s GDP.

Keep your files stored safely and securely with the SanDisk 2TB Extreme Portable SSD. With over 69,505 ratings and an impressive 4.6 out of 5 stars, this product has been purchased over 8K+ times in the past month. At only $129.99, this Amazon’s Choice product is a must-have for secure file storage.
Help keep private content private with the included password protection featuring 256-bit AES hardware encryption. Order now for just $129.99 on Amazon!
Help Power Techcratic’s Future – Scan To Support
If Techcratic’s content and insights have helped you, consider giving back by supporting the platform with crypto. Every contribution makes a difference, whether it’s for high-quality content, server maintenance, or future updates. Techcratic is constantly evolving, and your support helps drive that progress.
As a solo operator who wears all the hats, creating content, managing the tech, and running the site, your support allows me to stay focused on delivering valuable resources. Your support keeps everything running smoothly and enables me to continue creating the content you love. I’m deeply grateful for your support, it truly means the world to me! Thank you!
|
BITCOIN
bc1qlszw7elx2qahjwvaryh0tkgg8y68enw30gpvge Scan the QR code with your crypto wallet app |
|
DOGECOIN
D64GwvvYQxFXYyan3oQCrmWfidf6T3JpBA Scan the QR code with your crypto wallet app |
|
ETHEREUM
0xe9BC980DF3d985730dA827996B43E4A62CCBAA7a Scan the QR code with your crypto wallet app |


Please read the Privacy and Security Disclaimer on how Techcratic handles your support.
Disclaimer: As an Amazon Associate, Techcratic may earn from qualifying purchases.


