


![Conquest of Space / I Married a Monster from Outer Space [Blu-ray]](https://techcratic.com/wp-content/uploads/2025/09/81Yx1UahVuL._SL1500_-360x180.jpg)


Pallavi Rao
2025-06-20 01:40:00
www.visualcapitalist.com
![]() See this visualization first on the Voronoi app.
See this visualization first on the Voronoi app.
Ranked: European Countries by Income, Adjusted for Living Costs
This was originally posted on our Voronoi app. Download the app for free on iOS or Android and discover incredible data-driven charts from a variety of trusted sources.
Key Takeaways
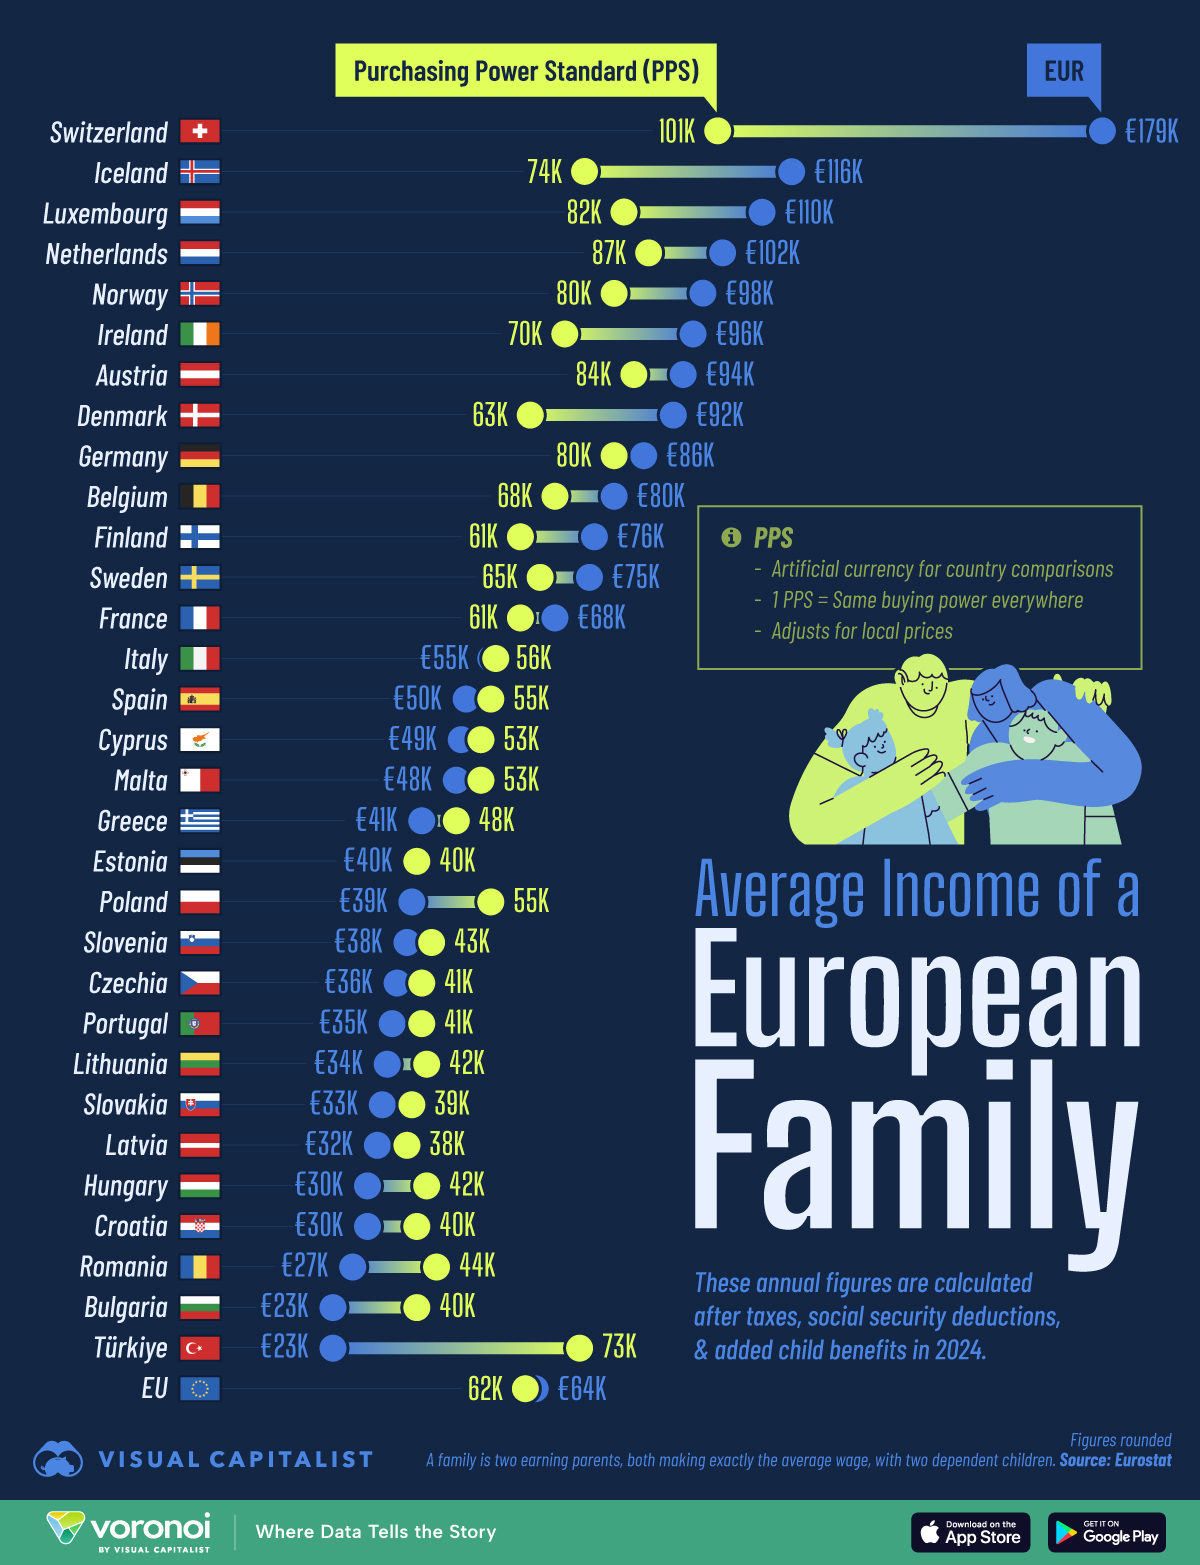
- This graphic compares 30 European countries by income, before and after cost of living adjustments.
- Family income in Switzerland is the highest in Europe at €179,000 a year, after taxes and social security contributions
- It’s lowest in Türkiye at €23,000 a year.
- However when adjusting for living costs, family income falls considerably in Switzerland, and grows 3x in Türkiye.
Trying to compare incomes without accounting for local prices is like trying to draw half a map. Useful for seeing where people are (earn), but not where they can actually go (spend).
The infographic compares 30 European countries by income, after taxes and social contributions, and then adjusts these figures for local prices by re-calculating the income in Purchasing Power Standard (PPS).
PPS is an artificial currency, created by the EU for country comparisons. Theoretically 1 PPS buys the same goods and services everywhere.
The data for this visualization comes from Eurostat, as of 2024.
 This annual household income is derived from assuming two parents are earning the average wage per country, with two dependent children.
Ranked: European Countries With the Highest Incomes in 2025
Switzerland ranks first with the highest euro income at €178,553. But when adjusted for cost of living, its purchasing power income falls to 100,777 PPS.
This reflects the high prices of goods and services in Switzerland, which eat into real spending power.
| Ranked by Euro Income |
Countries | Euro Income (2024) | PPS Income (2024) |
|---|---|---|---|
| 1 |  Switzerland Switzerland |
€178,553 | 100,777 |
| 2 |  Iceland Iceland |
€116,411 | 73,988 |
| 3 |  Luxembourg Luxembourg |
€110,438 | 82,439 |
| 4 |  Netherlands Netherlands |
€101,465 | 86,753 |
| 5 |  Norway Norway |
€97,580 | 79,979 |
| 6 |  Ireland Ireland |
€95,776 | 69,833 |
| 7 |  Austria Austria |
€93,722 | 83,870 |
| 8 |  Denmark Denmark |
€91,712 | 63,283 |
| 9 |  Germany Germany |
€86,372 | 79,606 |
| 10 |  Belgium Belgium |
€80,070 | 68,222 |
| 11 |  Finland Finland |
€76,150 | 61,224 |
| 12 |  Sweden Sweden |
€75,076 | 65,425 |
| 13 |  France France |
€68,228 | 60,801 |
| 14 |  Italy Italy |
€54,472 | 55,696 |
| 15 |  Spain Spain |
€50,060 | 54,978 |
| 16 |  Cyprus Cyprus |
€49,273 | 53,005 |
| 17 |  Malta Malta |
€48,048 | 52,795 |
| 18 |  Greece Greece |
€41,142 | 47,990 |
| 19 |  Estonia Estonia |
€39,965 | 39,598 |
| 20 |  Poland Poland |
€39,120 | 54,982 |
| 21 |  Slovenia Slovenia |
€38,209 | 42,679 |
| 22 |  Czechia Czechia |
€36,076 | 40,725 |
| 23 |  Portugal Portugal |
€35,394 | 40,804 |
| 24 |  Lithuania Lithuania |
€34,128 | 41,570 |
| 25 |  Slovakia Slovakia |
€32,940 | 39,294 |
| 26 |  Latvia Latvia |
€31,500 | 38,393 |
| 27 |  Hungary Hungary |
€29,788 | 41,718 |
| 28 |  Croatia Croatia |
€29,523 | 39,508 |
| 29 |  Romania Romania |
€26,766 | 44,043 |
| 30 |  Bulgaria Bulgaria |
€23,375 | 39,515 |
| 31 |  Türkiye Türkiye |
€22,880 | 72,731 |
| N/A |  EU EU |
€63,523 | 62,169 |
Still, it remains the top-ranked country even in PPS terms.
Meanwhile, Türkiye ranks last in pure euro terms with €22,880. However, its PPS-adjusted income is 72,731—more than triple its nominal value.
This catapults it near the top in real income terms, close to Ireland.
In fact, Ireland earns €95,776, over four times Türkiye’s nominal income. But both countries end up around 70,000 PPS.
This parity reveals that Turkish and Irish households have essentially the same purchasing power in their countries.
Why is this interesting?
Because beneath that parity lies a tale of two very different economies.
What Ireland and Türkiye’s Incomes Tell Us About Their Economies
Ireland’s high nominal income is inflated by its role as a global tax haven.
Multinational tech and pharma companies book massive profits there, distorting national income figures that don’t trickle evenly into the hands of local households.
Türkiye, meanwhile, has seen the opposite: incomes suppressed by runaway inflation and a devalued currency, even as daily essentials—from street food to local transit—remain affordable by global standards.
Despite economic turbulence, the country has some of the lowest grocery prices in Europe.
Even lifestyle patterns reflect this contrast. In Dublin, much of a middle-class income can be absorbed by rent, childcare, and other high fixed costs.
In Istanbul, while wages are lower, day-to-day expenses like food, transport, and housing tend to be more affordable, allowing for a more comfortable standard of living than the raw numbers might suggest.
Learn More on the Voronoi App 
Wondering how much this same list of countries are giving up in taxes? Check out: The World’s Big Tax Map for a quick overview.

Keep your files stored safely and securely with the SanDisk 2TB Extreme Portable SSD. With over 69,505 ratings and an impressive 4.6 out of 5 stars, this product has been purchased over 8K+ times in the past month. At only $129.99, this Amazon’s Choice product is a must-have for secure file storage.
Help keep private content private with the included password protection featuring 256-bit AES hardware encryption. Order now for just $129.99 on Amazon!
Help Power Techcratic’s Future – Scan To Support
If Techcratic’s content and insights have helped you, consider giving back by supporting the platform with crypto. Every contribution makes a difference, whether it’s for high-quality content, server maintenance, or future updates. Techcratic is constantly evolving, and your support helps drive that progress.
As a solo operator who wears all the hats, creating content, managing the tech, and running the site, your support allows me to stay focused on delivering valuable resources. Your support keeps everything running smoothly and enables me to continue creating the content you love. I’m deeply grateful for your support, it truly means the world to me! Thank you!
|
BITCOIN
bc1qlszw7elx2qahjwvaryh0tkgg8y68enw30gpvge Scan the QR code with your crypto wallet app |
|
DOGECOIN
D64GwvvYQxFXYyan3oQCrmWfidf6T3JpBA Scan the QR code with your crypto wallet app |
|
ETHEREUM
0xe9BC980DF3d985730dA827996B43E4A62CCBAA7a Scan the QR code with your crypto wallet app |


Please read the Privacy and Security Disclaimer on how Techcratic handles your support.
Disclaimer: As an Amazon Associate, Techcratic may earn from qualifying purchases.


