


Kayla Zhu
2025-07-04 12:17:00
www.visualcapitalist.com
China’s Urban Housing Decline
This was originally posted on our Voronoi app. Download the app for free on iOS or Android and discover incredible data-driven charts from a variety of trusted sources.
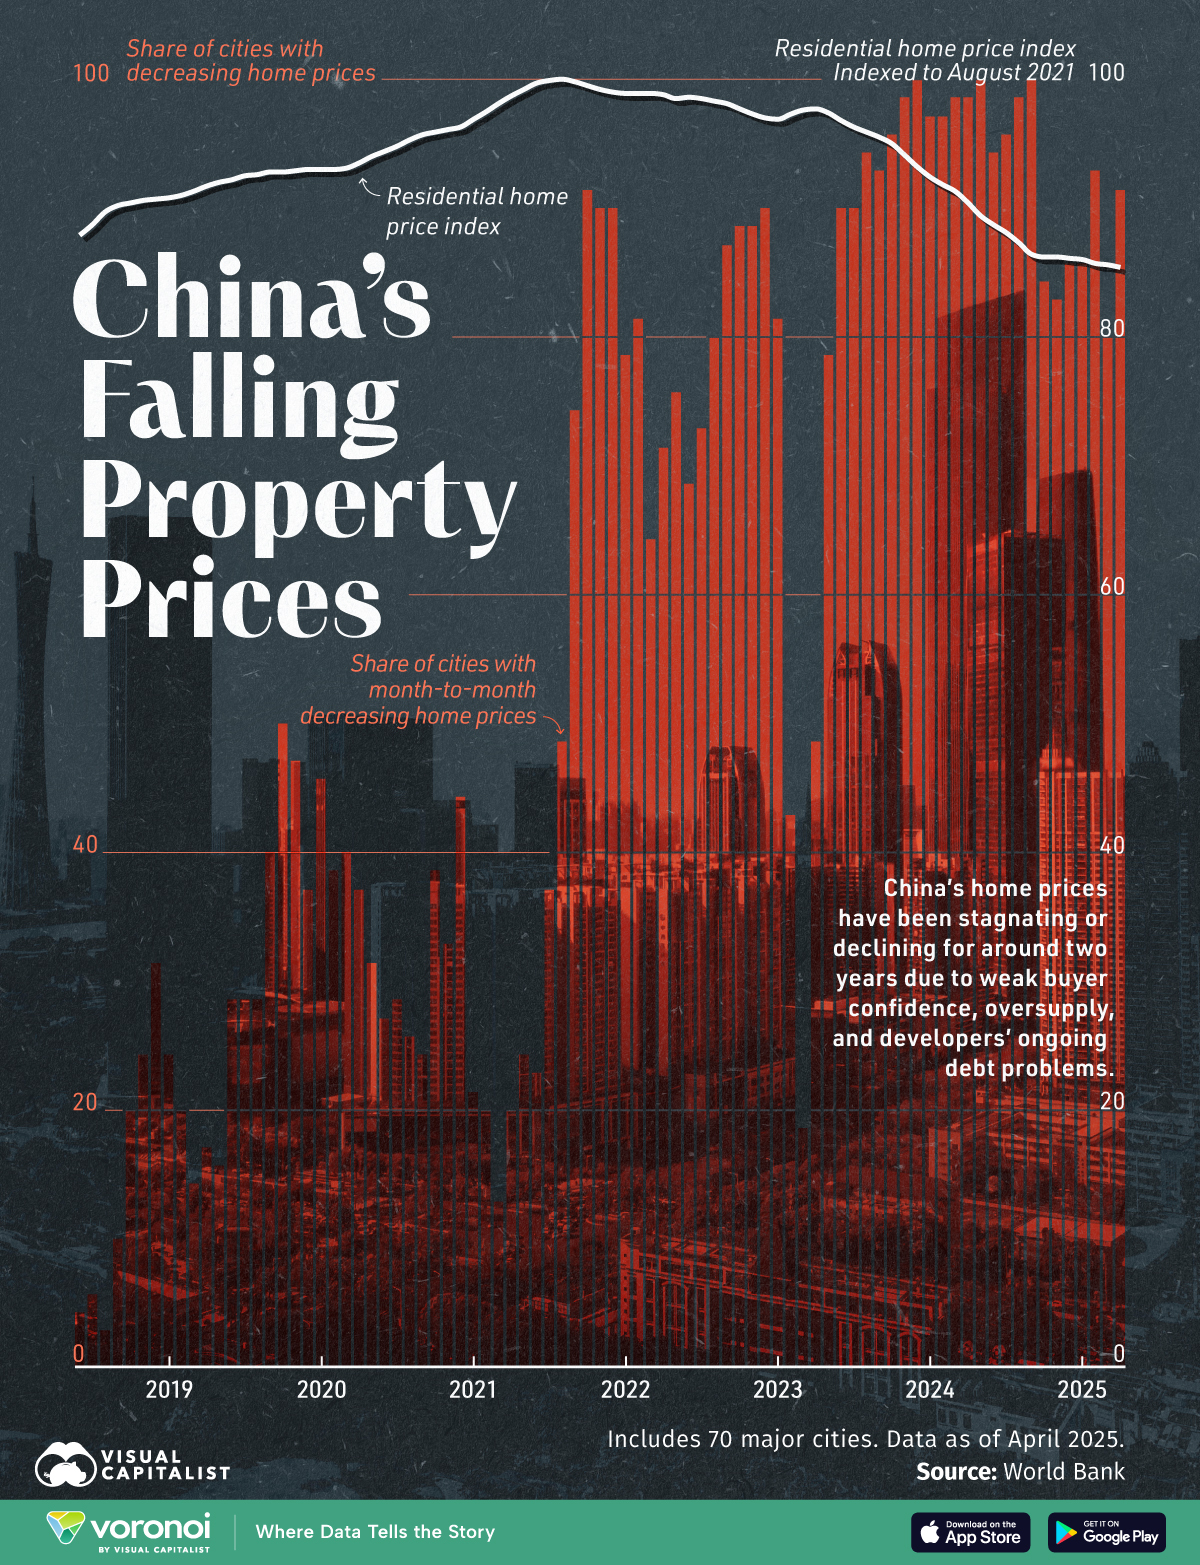
China’s real estate sector, once a key engine of the country’s economic growth, is experiencing a protracted downturn.
This graphic shows the share of Chinese cities with month-to-month decreasing home prices and China’s residential home price index (indexed to August 2021) from June 2018 to April 2025.
Data comes from World Bank, and includes 70 major Chinese cities.
China’s Real Estate Market Is In a Slump
Below, we show the share of Chinese cities with month-to-month decreasing home prices and China’s residential home price index from June 2018 to April 2025.
| Date | % of cities with MoM decreasing home prices |
Home price index |
|---|---|---|
| Jun-18 | 4.3 | 87.9 |
| Jul-18 | 5.7 | 88.7 |
| Aug-18 | 2.9 | 89.7 |
| Sep-18 | 10 | 90.2 |
| Oct-18 | 20 | 90.4 |
| Nov-18 | 24.3 | 90.6 |
| Dec-18 | 31.4 | 90.7 |
| Jan-19 | 24.3 | 90.8 |
| Feb-19 | 20 | 91 |
| Mar-19 | 14.3 | 91.3 |
| Apr-19 | 17.1 | 91.7 |
| May-19 | 15.7 | 92 |
| Jun-19 | 28.6 | 92.2 |
| Jul-19 | 28.6 | 92.5 |
| Aug-19 | 28.6 | 92.6 |
| Sep-19 | 40 | 92.8 |
| Oct-19 | 50 | 92.8 |
| Nov-19 | 47.1 | 92.9 |
| Dec-19 | 37.1 | 93 |
| Jan-20 | 45.7 | 93 |
| Feb-20 | 38.6 | 93 |
| Mar-20 | 40 | 93.1 |
| Apr-20 | 37.1 | 93.5 |
| May-20 | 31.4 | 94 |
| Jun-20 | 27.1 | 94.4 |
| Jul-20 | 28.6 | 94.8 |
| Aug-20 | 25.7 | 95.3 |
| Sep-20 | 24.3 | 95.7 |
| Oct-20 | 38.6 | 95.9 |
| Nov-20 | 32.9 | 96.1 |
| Dec-20 | 44.3 | 96.3 |
| Jan-21 | 21.4 | 96.9 |
| Feb-21 | 20 | 97.5 |
| Mar-21 | 12.9 | 98.1 |
| Apr-21 | 20 | 98.7 |
| May-21 | 24.3 | 99.2 |
| Jun-21 | 22.9 | 99.7 |
| Jul-21 | 37.1 | 99.9 |
| Aug-21 | 48.6 | 100 |
| Sep-21 | 74.3 | 99.8 |
| Oct-21 | 91.4 | 99.5 |
| Nov-21 | 90 | 99.2 |
| Dec-21 | 90 | 99 |
| Jan-22 | 78.6 | 98.9 |
| Feb-22 | 81.4 | 98.9 |
| Mar-22 | 64.3 | 98.9 |
| Apr-22 | 71.4 | 98.8 |
| May-22 | 75.7 | 98.5 |
| Jun-22 | 68.6 | 98.6 |
| Jul-22 | 72.9 | 98.5 |
| Aug-22 | 80 | 98.3 |
| Sep-22 | 87.1 | 98.1 |
| Oct-22 | 88.6 | 97.7 |
| Nov-22 | 88.6 | 97.3 |
| Dec-22 | 90 | 97 |
| Jan-23 | 81.4 | 96.9 |
| Feb-23 | 42.9 | 97.3 |
| Mar-23 | 18.6 | 97.6 |
| Apr-23 | 48.6 | 97.7 |
| May-23 | 78.6 | 97.4 |
| Jun-23 | 90 | 96.8 |
| Jul-23 | 90 | 96.3 |
| Aug-23 | 94.3 | 95.9 |
| Sep-23 | 92.9 | 95.5 |
| Oct-23 | 95.7 | 95 |
| Nov-23 | 98.6 | 94.1 |
| Dec-23 | 100 | 93.2 |
| Jan-24 | 97.1 | 92.4 |
| Feb-24 | 97.1 | 91.8 |
| Mar-24 | 98.6 | 91.3 |
| Apr-24 | 98.6 | 90.4 |
| May-24 | 100 | 89.4 |
| Jun-24 | 94.3 | 88.7 |
| Jul-24 | 95.7 | 88.1 |
| Aug-24 | 98.6 | 87.3 |
| Sep-24 | 100 | 86.4 |
| Oct-24 | 84.3 | 86.2 |
| Nov-24 | 82.9 | 86.2 |
| Dec-24 | 85.7 | 86.1 |
| Jan-25 | 85.7 | 86 |
| Feb-25 | 92.9 | 85.7 |
| Mar-25 | 80 | 85.6 |
| Apr-25 | 91.4 | 85.4 |
The share of Chinese cities with month-to-month price drops surged dramatically, from under 30% pre-2021 to over 90% in most months since late 2023.
In September 2024, May 2024, and December 2023, all 70 cities reported falling prices.
The residential home price index has declined by over 14% since August 2021, reflecting a prolonged and broad-based downturn in the property market. This sustained decline reflects structural weaknesses in the housing market, not just cyclical downturns. Since 2022, weak buyer confidence, oversupply, and developer debt have driven prices downward.
Stricter government regulations on lending and a crackdown on speculative buying have also squeezed developers and limited new investment, deepening the downturn in one of China’s most vital economic sectors.
However, there is still demand in some of China’s major housing markets. In Shanghai, $1 million buys just 474 square feet of prime real estate, a 47% decline in buying power over the past decade, highlighting how top-tier Chinese cities continue to attract high-end buyers despite the broader market slump.
Learn More on the Voronoi App 
To learn about China’s real estate crisis, check out this graphic that looks at China’s apartment and commercial property sales and housing starts.

Keep your files stored safely and securely with the SanDisk 2TB Extreme Portable SSD. With over 69,505 ratings and an impressive 4.6 out of 5 stars, this product has been purchased over 8K+ times in the past month. At only $129.99, this Amazon’s Choice product is a must-have for secure file storage.
Help keep private content private with the included password protection featuring 256-bit AES hardware encryption. Order now for just $129.99 on Amazon!
Help Power Techcratic’s Future – Scan To Support
If Techcratic’s content and insights have helped you, consider giving back by supporting the platform with crypto. Every contribution makes a difference, whether it’s for high-quality content, server maintenance, or future updates. Techcratic is constantly evolving, and your support helps drive that progress.
As a solo operator who wears all the hats, creating content, managing the tech, and running the site, your support allows me to stay focused on delivering valuable resources. Your support keeps everything running smoothly and enables me to continue creating the content you love. I’m deeply grateful for your support, it truly means the world to me! Thank you!
|
BITCOIN
bc1qlszw7elx2qahjwvaryh0tkgg8y68enw30gpvge Scan the QR code with your crypto wallet app |
|
DOGECOIN
D64GwvvYQxFXYyan3oQCrmWfidf6T3JpBA Scan the QR code with your crypto wallet app |
|
ETHEREUM
0xe9BC980DF3d985730dA827996B43E4A62CCBAA7a Scan the QR code with your crypto wallet app |


Please read the Privacy and Security Disclaimer on how Techcratic handles your support.
Disclaimer: As an Amazon Associate, Techcratic may earn from qualifying purchases.


