


Pallavi Rao
2025-07-14 08:13:00
www.visualcapitalist.com
Visualized: Every State’s Most Common Job in 1998 vs. 2024
This was originally posted on our Voronoi app. Download the app for free on iOS or Android and discover incredible data-driven charts from a variety of trusted sources.
Key Takeaways
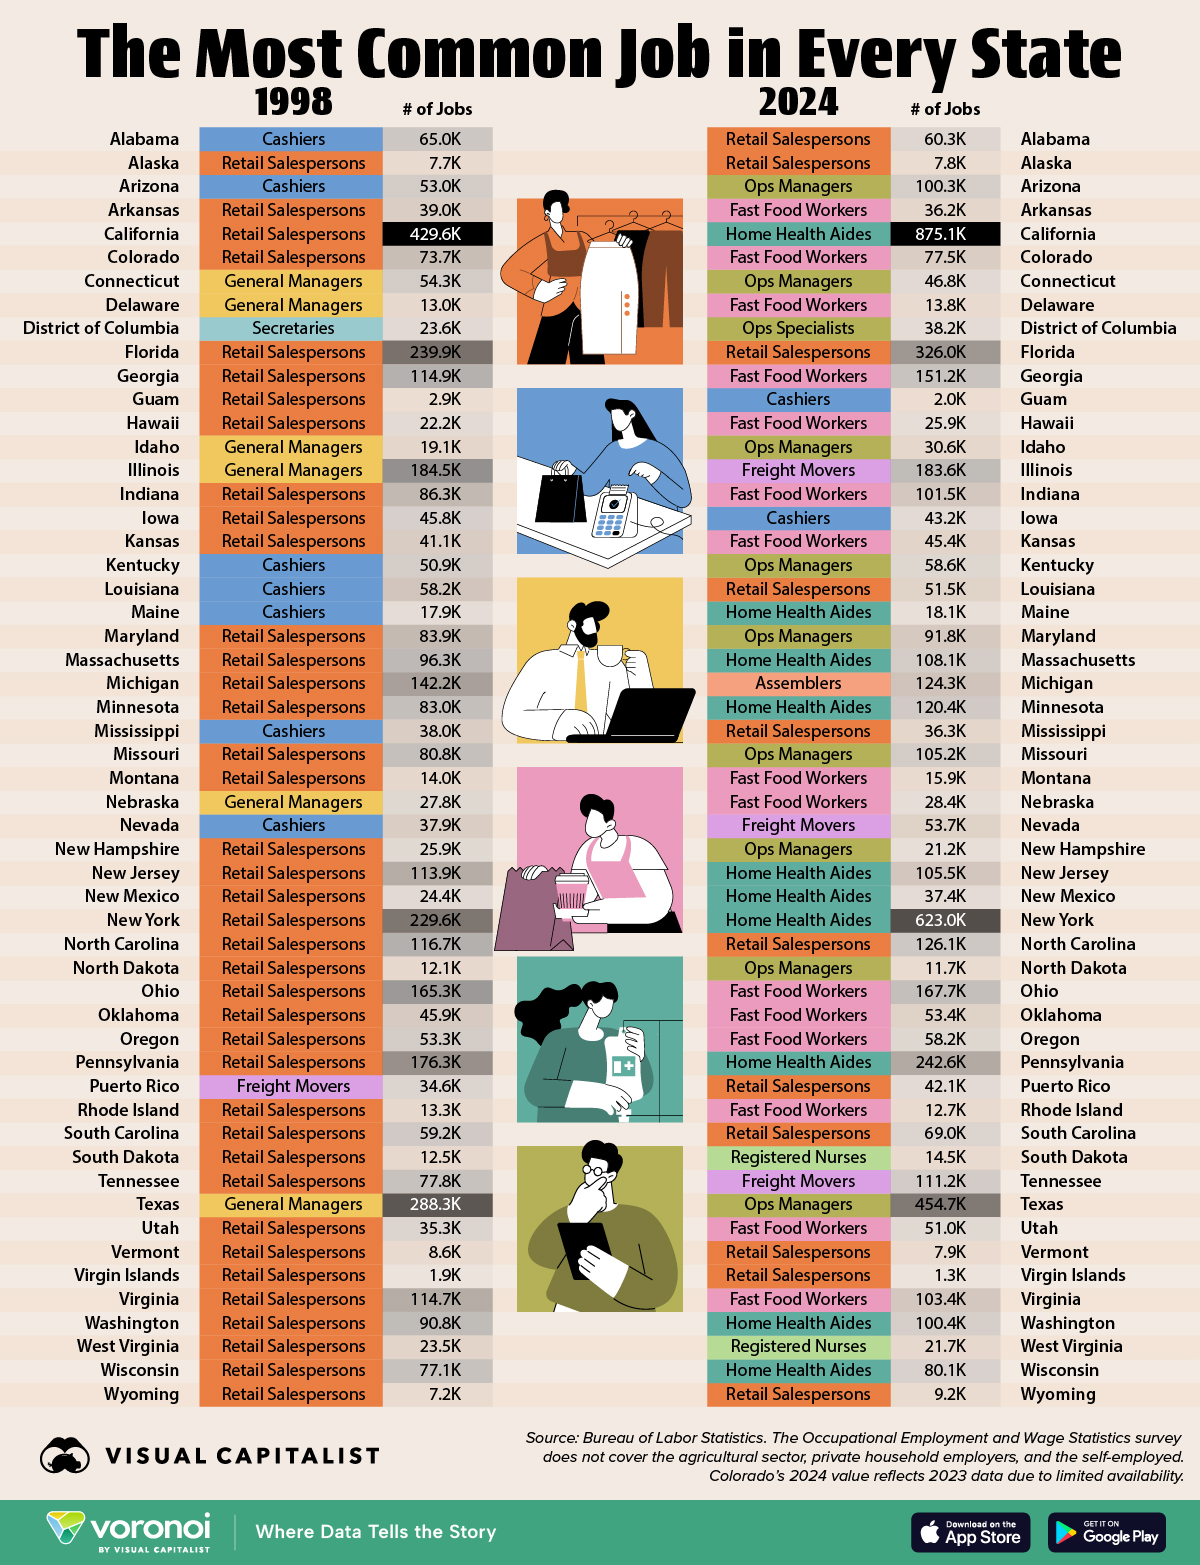
- Retail salesperson (39 states) and cashiers (7) were the most common job categories by state back in 1998.
- In 2024, it’s fast food worker (15 states) and retail salesperson (11).
- Home health aides are a new popular job category, the most common in 10 states.
1998 was a long time ago.
The first Matrix movie hadn’t yet released, the internet was still the purview of the Western world, and e-commerce giant Amazon was only five years old.
For obvious reasons, the U.S. labor market back then was different—but exactly how different?
This graphic compares the most common jobs in each U.S. state between 1998 to 2024, measured by the number of people employed in each category. Data for this visualization comes from the Bureau of Labor Statistics.
 Only the largest job category was chosen for each state, and several categories came within close ties of each other. Furthermore, the source does not collect estimates for the agriculture sector.
America’s Most Common Jobs in 1998, Listed
In 1998, retail salespersons were the most common job in 39 states.
Cashiers took the top spot in seven others, showing the strength of consumer-facing roles during a booming retail era.
| State | Most Common Job (1998) |
# of Jobs (1998) |
Most Common Job (2024) |
# of Jobs (2024) |
|---|---|---|---|---|
| Alabama |  Cashiers Cashiers |
64,990 |  Retail Salespersons Retail Salespersons |
60,330 |
| Alaska | Retail Salespersons |
7,650 | Retail Salespersons |
7,790 |
| Arizona | Cashiers |
52,950 |  Ops Managers Ops Managers |
100,340 |
| Arkansas | Retail Salespersons |
38,950 |  Fast Food Workers Fast Food Workers |
36,150 |
| California | Retail Salespersons |
429,600 |  Home Health Aides Home Health Aides |
875,110 |
| Colorado | Retail Salespersons |
73,680 | Fast Food Workers |
77,500 |
| Connecticut |  General Managers General Managers |
54,300 | Ops Managers |
46,780 |
| Delaware | General Managers |
12,950 | Fast Food Workers |
13,800 |
| District of Columbia |  Secretaries Secretaries |
23,590 |  Ops Specialists Ops Specialists |
38,240 |
| Florida | Retail Salespersons |
239,940 | Retail Salespersons |
325,960 |
| Georgia | Retail Salespersons |
114,920 | Fast Food Workers |
151,240 |
| Guam | Retail Salespersons |
2,860 | Cashiers |
1,960 |
| Hawaii | Retail Salespersons |
22,180 | Fast Food Workers |
25,850 |
| Idaho | General Managers |
19,130 | Ops Managers |
30,600 |
| Illinois | General Managers |
184,490 |  Freight Movers Freight Movers |
183,590 |
| Indiana | Retail Salespersons |
86,310 | Fast Food Workers |
101,500 |
| Iowa | Retail Salespersons |
45,820 | Cashiers |
43,160 |
| Kansas | Retail Salespersons |
41,070 | Fast Food Workers |
45,420 |
| Kentucky | Cashiers |
50,910 | Ops Managers |
58,570 |
| Louisiana | Cashiers |
58,180 | Retail Salespersons |
51,540 |
| Maine | Cashiers |
17,910 | Home Health Aides |
18,080 |
| Maryland | Retail Salespersons |
83,900 | Ops Managers |
91,810 |
| Massachusetts | Retail Salespersons |
96,300 | Home Health Aides |
108,090 |
| Michigan | Retail Salespersons |
142,220 |  Assemblers Assemblers |
124,340 |
| Minnesota | Retail Salespersons |
83,040 | Home Health Aides |
120,390 |
| Mississippi | Cashiers |
38,030 | Retail Salespersons |
36,330 |
| Missouri | Retail Salespersons |
80,770 | Ops Managers |
105,210 |
| Montana | Retail Salespersons |
13,960 | Fast Food Workers |
15,940 |
| Nebraska | General Managers |
27,760 | Fast Food Workers |
28,360 |
| Nevada | Cashiers |
37,890 | Freight Movers |
53,660 |
| New Hampshire | Retail Salespersons |
25,940 | Ops Managers |
21,180 |
| New Jersey | Retail Salespersons |
113,890 | Home Health Aides |
105,460 |
| New Mexico | Retail Salespersons |
24,370 | Home Health Aides |
37,360 |
| New York | Retail Salespersons |
229,620 | Home Health Aides |
623,000 |
| North Carolina | Retail Salespersons |
116,680 | Retail Salespersons |
126,060 |
| North Dakota | Retail Salespersons |
12,140 | Ops Managers |
11,660 |
| Ohio | Retail Salespersons |
165,290 | Fast Food Workers |
167,650 |
| Oklahoma | Retail Salespersons |
45,860 | Fast Food Workers |
53,380 |
| Oregon | Retail Salespersons |
53,300 | Fast Food Workers |
58,150 |
| Pennsylvania | Retail Salespersons |
176,330 | Home Health Aides |
242,570 |
| Puerto Rico | Freight Movers |
34,560 | Retail Salespersons |
42,070 |
| Rhode Island | Retail Salespersons |
13,340 | Fast Food Workers |
12,650 |
| South Carolina | Retail Salespersons |
59,230 | Retail Salespersons |
69,010 |
| South Dakota | Retail Salespersons |
12,480 |  Registered Nurses Registered Nurses |
14,500 |
| Tennessee | Retail Salespersons |
77,760 | Freight Movers |
111,240 |
| Texas | General Managers |
288,290 | Ops Managers |
454,720 |
| Utah | Retail Salespersons |
35,310 | Fast Food Workers |
50,980 |
| Vermont | Retail Salespersons |
8,630 | Retail Salespersons |
7,930 |
| Virgin Islands | Retail Salespersons |
1,860 | Retail Salespersons |
1,310 |
| Virginia | Retail Salespersons |
114,740 | Fast Food Workers |
103,390 |
| Washington | Retail Salespersons |
90,760 | Home Health Aides |
100,360 |
| West Virginia | Retail Salespersons |
23,450 | Registered Nurses |
21,740 |
| Wisconsin | Retail Salespersons |
77,080 | Home Health Aides |
80,050 |
| Wyoming | Retail Salespersons |
7,170 | Retail Salespersons |
9,190 |
Note: D.C., Guam, Puerto Rico, and the Virgin Islands have been included in this graphic and article. They have been referred to as states for general trend analysis.
The data reflects a time when brick-and-mortar stores and administrative support jobs were critical to state economies.
America’s Most Common Jobs in 2024, Listed
By 2024, fast food workers became the most common job in 15 states, overtaking retail in sheer prevalence.
This rise aligns with the growth of quick-service restaurants and a broader shift toward lower-wage, flexible service jobs.
Retail salespersons remain the top job in 11 states, while operations managers, home health aides, and freight movers have gained ground in several others.
Healthcare and Logistics Jobs in the 2020s
Notably, home health aides became the most common job in five states, including California and New York.
This highlights the aging U.S. population and rising demand for elder care services.
Meanwhile, freight movers and operations managers now top the charts in states like Illinois, Tennessee, and Texas. This signals that retail is still a strong sector, but the jobs have moved towards logistics and supply chain roles as in-person buying drops.
Learn More on the Voronoi App 
These healthcare jobs are possibly the safest in an AI world. Check out Ranked: The Fastest Growing Jobs in the U.S. (2023-2033F) on Voronoi, the new app from Visual Capitalist.

Keep your files stored safely and securely with the SanDisk 2TB Extreme Portable SSD. With over 69,505 ratings and an impressive 4.6 out of 5 stars, this product has been purchased over 8K+ times in the past month. At only $129.99, this Amazon’s Choice product is a must-have for secure file storage.
Help keep private content private with the included password protection featuring 256-bit AES hardware encryption. Order now for just $129.99 on Amazon!
Help Power Techcratic’s Future – Scan To Support
If Techcratic’s content and insights have helped you, consider giving back by supporting the platform with crypto. Every contribution makes a difference, whether it’s for high-quality content, server maintenance, or future updates. Techcratic is constantly evolving, and your support helps drive that progress.
As a solo operator who wears all the hats, creating content, managing the tech, and running the site, your support allows me to stay focused on delivering valuable resources. Your support keeps everything running smoothly and enables me to continue creating the content you love. I’m deeply grateful for your support, it truly means the world to me! Thank you!
|
BITCOIN
bc1qlszw7elx2qahjwvaryh0tkgg8y68enw30gpvge Scan the QR code with your crypto wallet app |
|
DOGECOIN
D64GwvvYQxFXYyan3oQCrmWfidf6T3JpBA Scan the QR code with your crypto wallet app |
|
ETHEREUM
0xe9BC980DF3d985730dA827996B43E4A62CCBAA7a Scan the QR code with your crypto wallet app |


Please read the Privacy and Security Disclaimer on how Techcratic handles your support.
Disclaimer: As an Amazon Associate, Techcratic may earn from qualifying purchases.


