


Niccolo Conte
2025-07-15 13:29:00
www.visualcapitalist.com
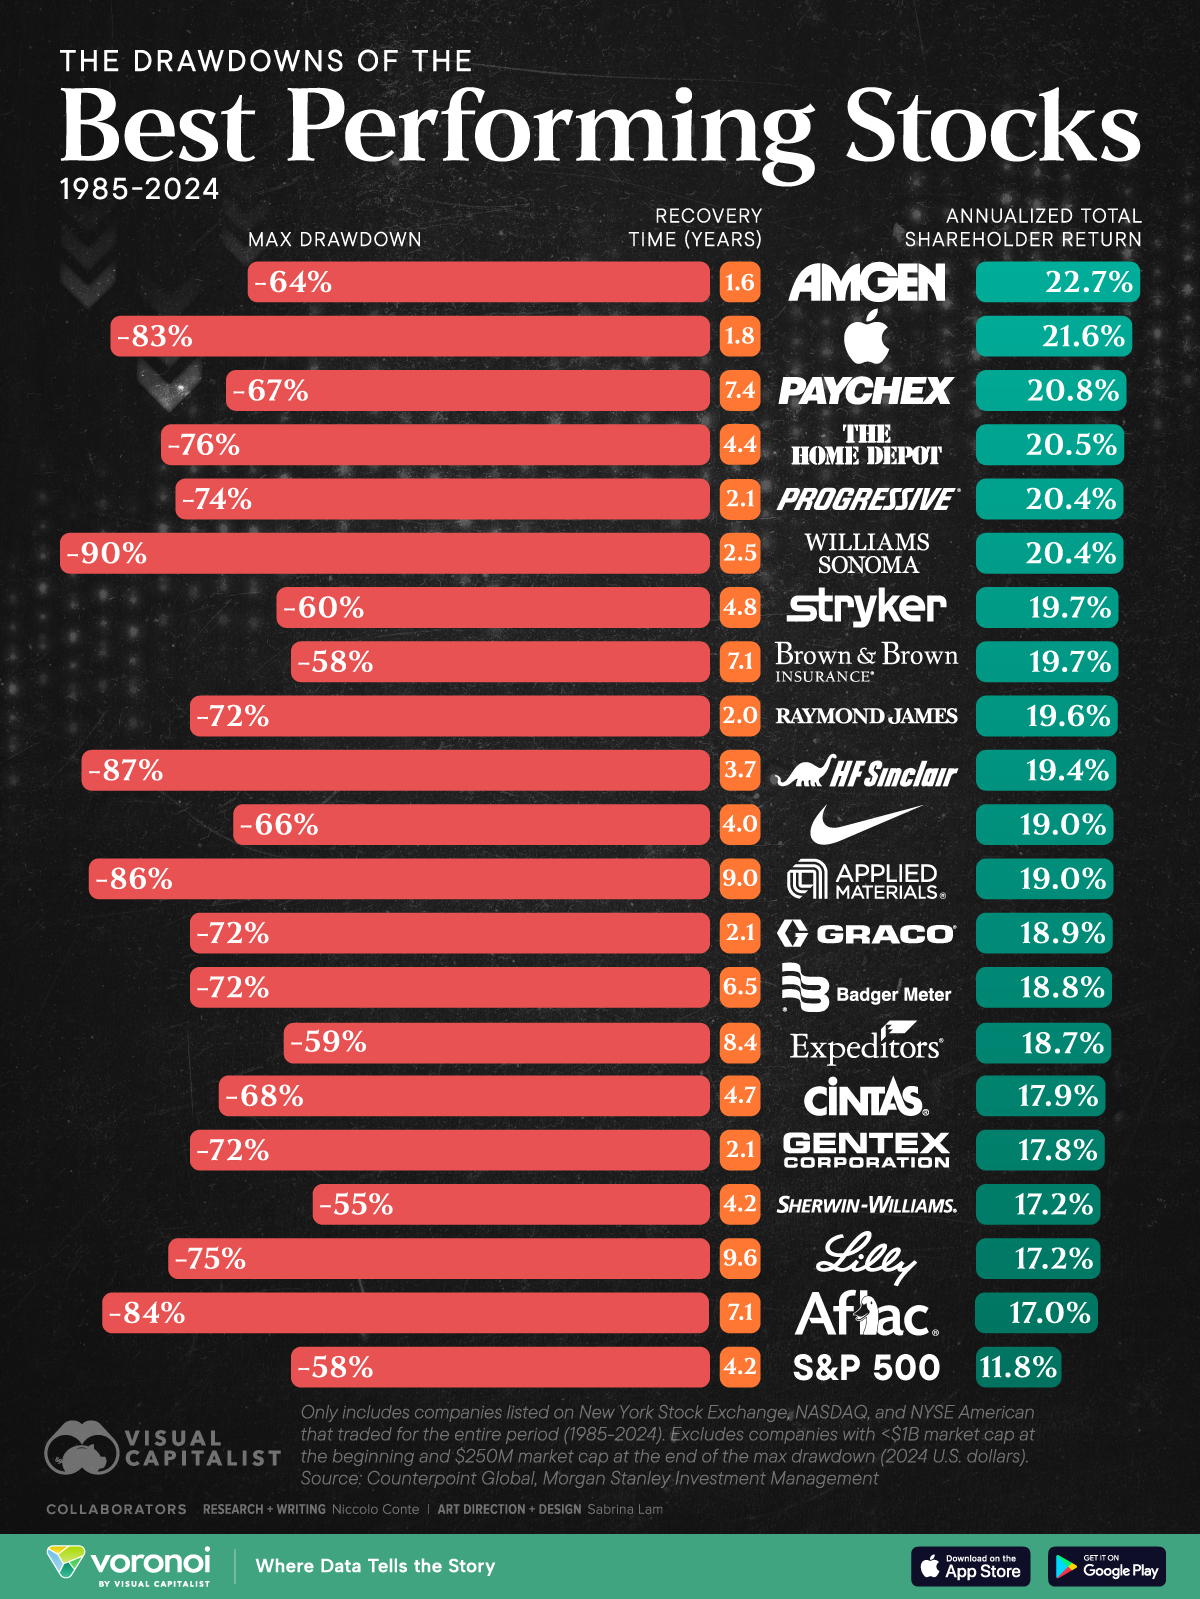
Charted: The Drawdowns of the Best-Performing U.S. Stocks (1985–2024)
This was originally posted on our Voronoi app. Download the app for free on iOS or Android and discover incredible data-driven charts from a variety of trusted sources.
Key Takeaways
- The 20 best-performing U.S. stocks from 1985 to 2024 saw a 72% average drawdown, and took 4.8 years to recover
- The S&P 500 index fell 55% from peak to trough, and recovered in 4.2 years
Investors are often drawn to the attractive returns of legendary stocks, but even the best investments face large drawdowns when held for the long term.
This chart shows the top 20 publicly traded U.S. companies by annualized total shareholder return between 1985 and 2024, and shows each stock’s maximum drawdown (peak-to-trough decline) and recovery time. The data comes from Morgan Stanley’s Counterpoint Global Insights.
The Volatility Behind Long-Term Returns
On average, the top 20 best-performing U.S. stocks delivered an annualized return of 19.3% over the 40-year period, beating the S&P 500’s 11.8%. However, nearly all of them suffered losses of 55% or more from peak to trough at some point, and some took nearly a decade to recover.
Here’s a look at the drawdowns and recovery timelines of America’s top-performing stocks from 1985 to 2024:
| Company | Annualized Total Shareholder Return (1985-2024) | Max Drawdown | Recovery time (years) |
|---|---|---|---|
| Amgen | 22.7% | -64% | 1.6 |
| Apple | 21.6% | -83% | 1.8 |
| Paychex | 20.8% | -67% | 7.4 |
| Home Depot | 20.5% | -76% | 4.4 |
| Progressive Corporation | 20.4% | -74% | 2.1 |
| Williams-Sonoma | 20.4% | -90% | 2.5 |
| Stryker Corporation | 19.7% | -60% | 4.8 |
| Brown & Brown | 19.7% | -58% | 7.1 |
| Raymond James Financial | 19.6% | -72% | 2.0 |
| HF Sinclair Corporation | 19.4% | -87% | 3.7 |
| NIKE | 19.0% | -66% | 4.0 |
| Applied Materials | 19.0% | -86% | 9.0 |
| Graco | 18.9% | -72% | 2.1 |
| Badger Meter | 18.8% | -72% | 6.5 |
| Expeditors International | 18.7% | -59% | 8.4 |
| Cintas Corporation | 17.9% | -68% | 4.7 |
| Gentex Corporation | 17.8% | -72% | 2.1 |
| Sherwin-Williams | 17.2% | -55% | 4.2 |
| Eli Lilly and Company | 17.2% | -75% | 9.6 |
| Aflac Incorporated | 17.0% | -84% | 7.1 |
| S&P 500 | 11.8% | -58% | 4.2 |
Amgen, a biotech firm and the top-performing stock, delivered a 22.7% annualized return from 1985 to 2024. It also saw a sharp 64% fall in just 0.6 years, though it recovered faster than any other stock on the list.
Apple, the second-best performer over the 40 years, dropped 83% during its roughest patch, but went on to post a 123% return in the first year post-drawdown.
Williams-Sonoma, a kitchenware and furniture firm, saw the worst crash of the top 20 stocks, losing 90% of its value during the 2008 Financial Crisis. However, the firm has persevered, delivering a 20.4% annualized return from 1985–2024, with a 371% return in just one year from the bottom.
Eli Lilly and Co. took the longest to recover from its maximum drawdown, taking 9.6 years to return to its peak. Its drawdown lasted 8.7 years from the year 2000 to 2009, the longest of any stock on the list.
On average, the top 20 stocks saw a maximum drawdown of 72%, and took 4.8 years to recover. In comparison, the S&P 500 index fell 55% in its biggest drawdown, and recovered in 4.2 years.
Why Staying Invested Matters
Investors who stay invested often ride through the highs and lows, seeing higher overall appreciation over the long term.
Historical data shows that being fully invested over a 20-year period outperforms attempts to time the market, and missing just a few of the market’s best days can drastically reduce total returns.
Furthermore, long-term holding allows investors to compound their gains, although it can come at the expense of large drawdowns.
Learn More on the Voronoi App 
If you enjoyed this infographic, see The S&P 500’s Yearly Declines and Returns on Voronoi, the new app from Visual Capitalist.

Keep your files stored safely and securely with the SanDisk 2TB Extreme Portable SSD. With over 69,505 ratings and an impressive 4.6 out of 5 stars, this product has been purchased over 8K+ times in the past month. At only $129.99, this Amazon’s Choice product is a must-have for secure file storage.
Help keep private content private with the included password protection featuring 256-bit AES hardware encryption. Order now for just $129.99 on Amazon!
Help Power Techcratic’s Future – Scan To Support
If Techcratic’s content and insights have helped you, consider giving back by supporting the platform with crypto. Every contribution makes a difference, whether it’s for high-quality content, server maintenance, or future updates. Techcratic is constantly evolving, and your support helps drive that progress.
As a solo operator who wears all the hats, creating content, managing the tech, and running the site, your support allows me to stay focused on delivering valuable resources. Your support keeps everything running smoothly and enables me to continue creating the content you love. I’m deeply grateful for your support, it truly means the world to me! Thank you!
|
BITCOIN
bc1qlszw7elx2qahjwvaryh0tkgg8y68enw30gpvge Scan the QR code with your crypto wallet app |
|
DOGECOIN
D64GwvvYQxFXYyan3oQCrmWfidf6T3JpBA Scan the QR code with your crypto wallet app |
|
ETHEREUM
0xe9BC980DF3d985730dA827996B43E4A62CCBAA7a Scan the QR code with your crypto wallet app |


Please read the Privacy and Security Disclaimer on how Techcratic handles your support.
Disclaimer: As an Amazon Associate, Techcratic may earn from qualifying purchases.


