


Pallavi Rao
2025-07-16 02:17:00
www.visualcapitalist.com
![]() See this visualization first on the Voronoi app.
See this visualization first on the Voronoi app.
Ranked: Countries With the Highest & Lowest Pensions in Europe
This was originally posted on our Voronoi app. Download the app for free on iOS or Android and discover incredible data-driven charts from a variety of trusted sources.
Key Takeaways
- Rich Western economies like Iceland, Luxembourg, and Norway can afford annual pensions north of €30,000 per retiree.
- Poland and Hungary spend a big slice of GDP on pensions, yet smaller tax bases keep payouts below €7,000.
- The seven-fold gap between Iceland and Hungary proves pension size tracks economic heft, not political will.
Several generations are already saying they won’t retire due to financial anxieties.
But what about today’s retirees? How are they making ends meet, and what do current-day pensions actually look like?
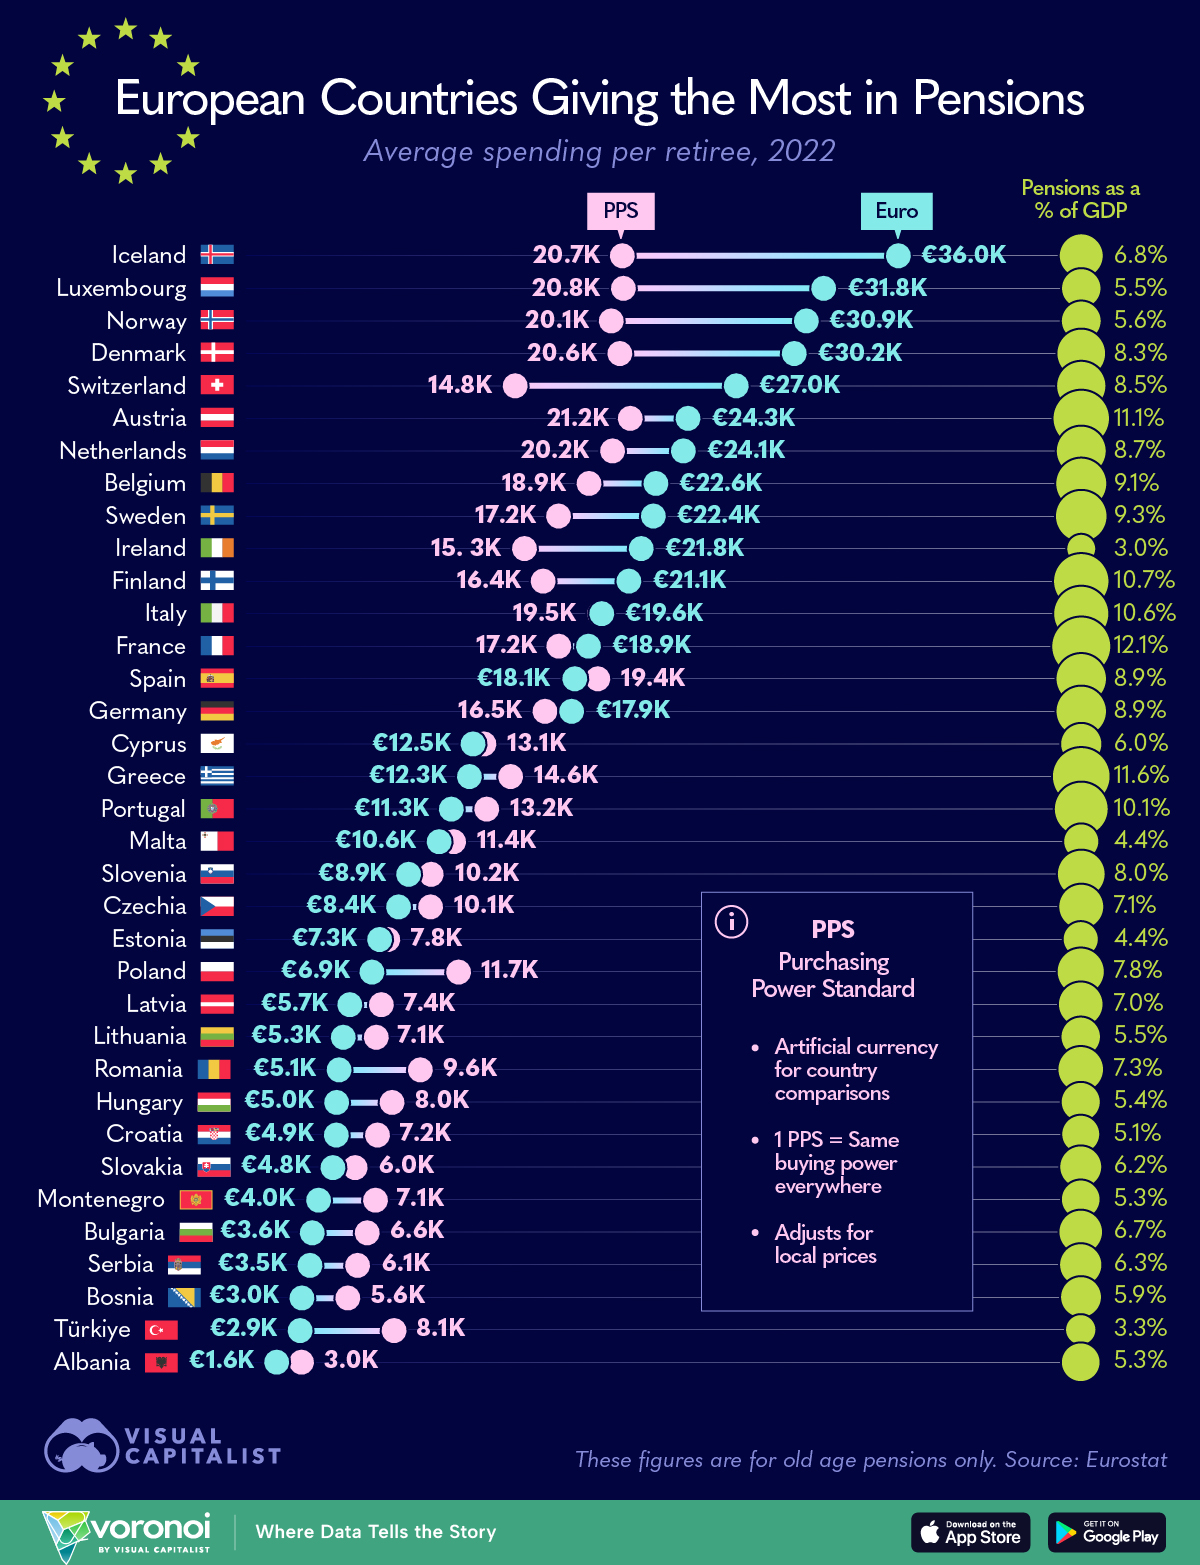
This chart visualizes the latest figures available for annual public pension spending per retiree across 35 European economies, alongside the share of national output devoted to old-age benefits.
Data for this visualization come from two separate Eurostat databases, linked here and here.
Europe’s total public pension expenditure in 2022 is divided by the number of pension beneficiaries, and converted figures into euros as well as the purchasing power standard (PPS).
Pension expenditure as a share of GDP can be accessed in the first source, by toggling a panel.
 PPS is an artificial currency created by the EU for country-comparisons by adjusting for local prices. Theoretically 1 PPS can buy the same amount of goods (or services) everywhere.
Ranked: European Countries With the Best Retirement Pensions
Iceland, Luxembourg, and Norway occupy the podium with annual payouts above €30,000.
High wages, strong fiscal revenues from energy or finance, and robust compulsory saving pillars give these small, rich economies room to fund generous benefits.
| Euro Rank | Country | Retirement Spend Per Capita, 2022 |
Retirement Spend Per Capita (PPS, 2022) |
Retirement Spending (Share of GDP, 2022) |
|---|---|---|---|---|
| 1 |  Iceland Iceland |
€36.0K | 20.7K | 6.8% |
| 2 |  Luxembourg Luxembourg |
€31.8K | 20.8K | 5.5% |
| 3 |  Norway Norway |
€30.9K | 20.1K | 5.6% |
| 4 |  Denmark Denmark |
€30.2K | 20.6K | 8.3% |
| 5 |  Switzerland Switzerland |
€27.0K | 14.8K | 8.5% |
| 6 |  Austria Austria |
€24.3K | 21.2K | 11.1% |
| 7 |  Netherlands Netherlands |
€24.1K | 20.2K | 8.7% |
| 8 |  Belgium Belgium |
€22.6K | 18.9K | 9.1% |
| 9 |  Sweden Sweden |
€22.4K | 17.2K | 9.3% |
| 10 |  Ireland Ireland |
€21.8K | 15.3K | 3.0% |
| 11 |  Finland Finland |
€21.1K | 16.4K | 10.7% |
| 12 |  Italy Italy |
€19.6K | 19.5K | 10.6% |
| 13 |  France France |
€18.9K | 17.2K | 12.1% |
| 14 |  Spain Spain |
€18.1K | 19.4K | 8.9% |
| 15 |  Germany Germany |
€17.9K | 16.5K | 8.9% |
| 16 |  Cyprus Cyprus |
€12.5K | 13.1K | 6.0% |
| 17 |  Greece Greece |
€12.3K | 14.6K | 11.6% |
| 18 |  Portugal Portugal |
€11.3K | 13.2K | 10.1% |
| 19 |  Malta Malta |
€10.6K | 11.4K | 4.4% |
| 20 |  Slovenia Slovenia |
€8.9K | 10.2K | 8.0% |
| 21 |  Czechia Czechia |
€8.4K | 10.1K | 7.1% |
| 22 |  Estonia Estonia |
€7.3K | 7.8K | 4.4% |
| 23 |  Poland Poland |
€6.9K | 11.7K | 7.8% |
| 24 |  Latvia Latvia |
€5.7K | 7.4K | 7.0% |
| 25 |  Lithuania Lithuania |
€5.3K | 7.1K | 5.5% |
| 26 |  Romania Romania |
€5.1K | 9.6K | 7.3% |
| 27 |  Hungary Hungary |
€5.0K | 8.0K | 5.4% |
| 28 |  Croatia Croatia |
€4.9K | 7.2K | 5.1% |
| 29 |  Slovakia Slovakia |
€4.8K | 6.0K | 6.2% |
| 30 |  Montenegro Montenegro |
€4.0K | 7.1K | 5.3% |
| 31 |  Bulgaria Bulgaria |
€3.6K | 6.6K | 6.7% |
| 32 |  Serbia Serbia |
€3.5K | 6.1K | 6.3% |
| 33 |  Bosnia & Herzegovina Bosnia & Herzegovina |
€3.0K | 5.6K | 5.9% |
| 34 |  Turkey Turkey |
€2.9K | 8.1K | 3.3% |
| 35 |  Albania Albania |
€1.6K | 3.0K | 5.3% |
| N/A |  EU Average EU Average |
€16.1K | 16.1K | 9.3% |
Denmark and Switzerland complete the top five, each coupling universal basic pensions with mandatory occupational pension schemes.
In all five, benefits still consume less than 9% of GDP—well under the EU average (12.2% of GDP)—thanks to higher tax bases.
Southern European Countries Spend More on Retirement for Less
On the other hand, Italy, France, and Spain devote between 9% and 12% of GDP to pensions yet deliver under €20,000 per beneficiary, though this is higher when adjusted for purchasing power parity.
Aging populations, pay-as-you-go formulas, and sluggish growth squeeze sustainability.
EU rules encouraging later retirement ages and indexing benefits to prices rather than wages could help close the gap.
Eastern Europe’s Low Payouts Reflect Lean Tax Bases
In Poland and Hungary, pensions claim a similar GDP share to Nordic peers, but payouts sit below €7,000.
Lower productivity limits contribution inflows, and decades of emigration shrink workforces further.
Converting to PPS narrows the gap—Polish retirees receive 11,700 in purchasing power standard—yet real incomes remain modest.
Rising wages, higher participation among older workers, and optional funded pillars could lift adequacy without blowing up budgets.
This ranking thus exposes how both absolute wealth and policy choices shape retirement security.
Learn More on the Voronoi App 
If you enjoyed today’s post, check out Average Wages Across Europe on Voronoi, the new app from Visual Capitalist.

Keep your files stored safely and securely with the SanDisk 2TB Extreme Portable SSD. With over 69,505 ratings and an impressive 4.6 out of 5 stars, this product has been purchased over 8K+ times in the past month. At only $129.99, this Amazon’s Choice product is a must-have for secure file storage.
Help keep private content private with the included password protection featuring 256-bit AES hardware encryption. Order now for just $129.99 on Amazon!
Help Power Techcratic’s Future – Scan To Support
If Techcratic’s content and insights have helped you, consider giving back by supporting the platform with crypto. Every contribution makes a difference, whether it’s for high-quality content, server maintenance, or future updates. Techcratic is constantly evolving, and your support helps drive that progress.
As a solo operator who wears all the hats, creating content, managing the tech, and running the site, your support allows me to stay focused on delivering valuable resources. Your support keeps everything running smoothly and enables me to continue creating the content you love. I’m deeply grateful for your support, it truly means the world to me! Thank you!
|
BITCOIN
bc1qlszw7elx2qahjwvaryh0tkgg8y68enw30gpvge Scan the QR code with your crypto wallet app |
|
DOGECOIN
D64GwvvYQxFXYyan3oQCrmWfidf6T3JpBA Scan the QR code with your crypto wallet app |
|
ETHEREUM
0xe9BC980DF3d985730dA827996B43E4A62CCBAA7a Scan the QR code with your crypto wallet app |


Please read the Privacy and Security Disclaimer on how Techcratic handles your support.
Disclaimer: As an Amazon Associate, Techcratic may earn from qualifying purchases.


