


Niccolo Conte
2025-08-09 13:47:00
www.visualcapitalist.com
Charted: The Rise of Conflicts in Developing Regions
This was originally posted on our Voronoi app. Download the app for free on iOS or Android and discover incredible data-driven charts from a variety of trusted sources.
Key Takeaways
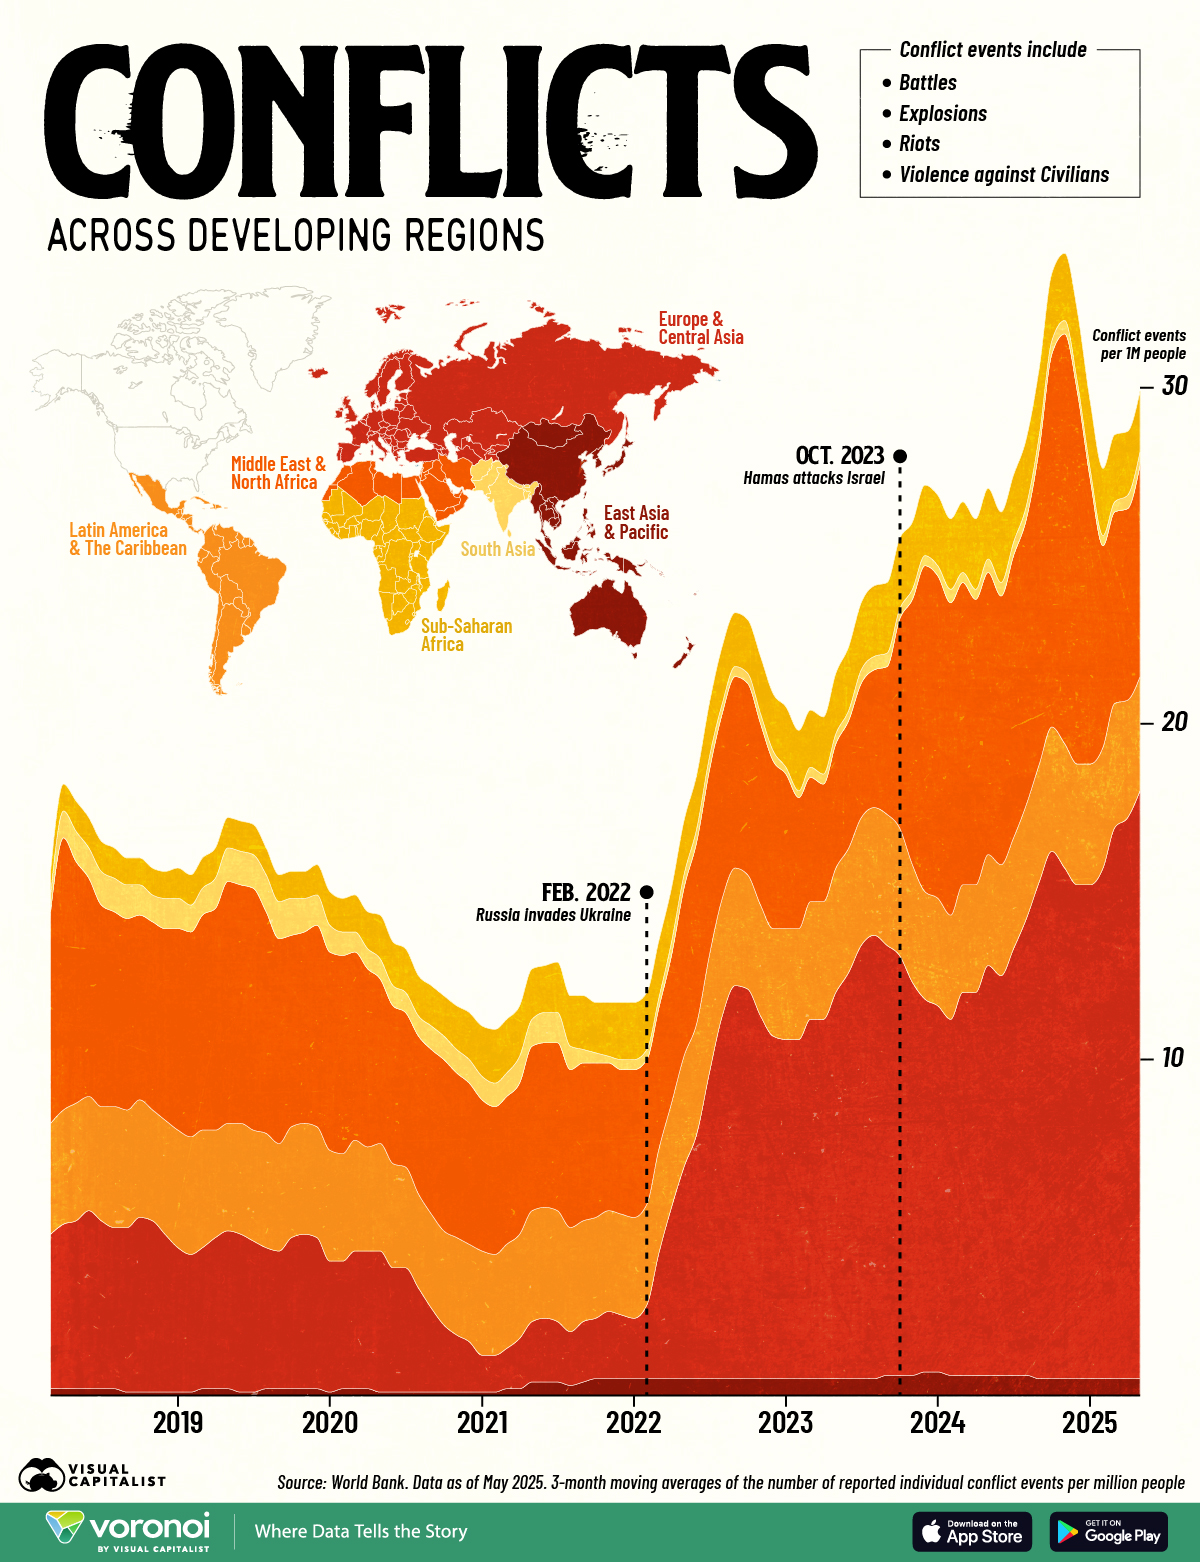
- Over the past three years, Europe & Central Asia and the Middle East & North Africa have been the largest contributors to elevated global conflict rates.
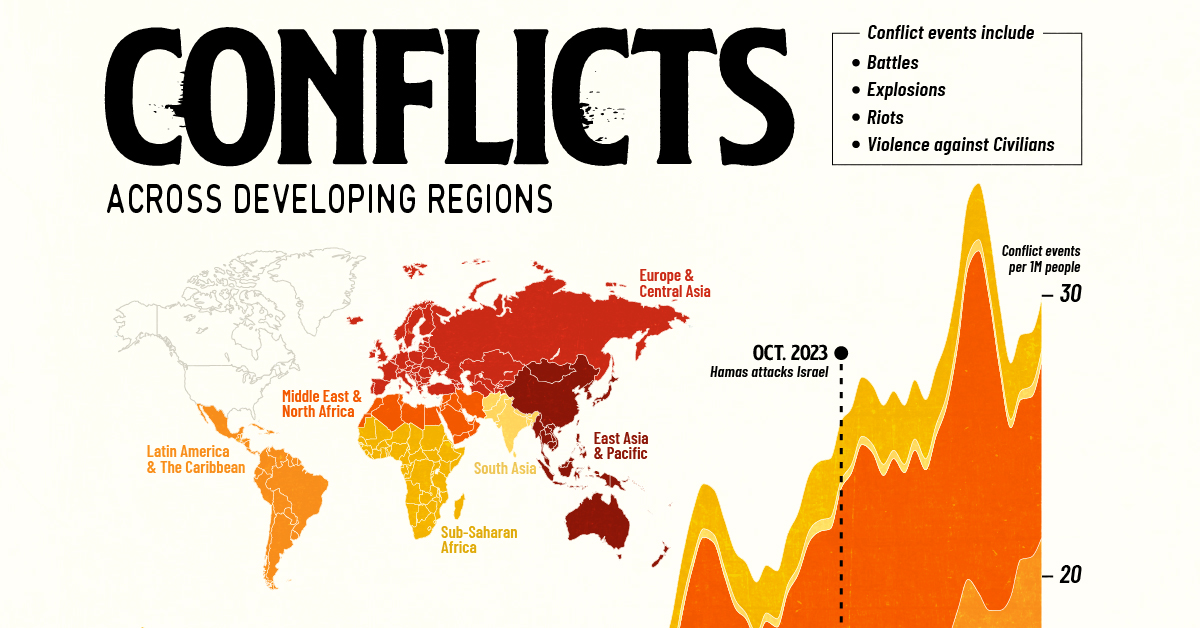
- Major spikes in conflicts are kickstarted by geopolitical flashpoints, including Russia’s invasion of Ukraine in February 2022 and the Hamas attack on Israel in October 2023.
Rising geopolitical tensions and regional instability have caused conflict levels to surge in many parts of the world, especially in developing regions.
This visualization highlights the number of conflict events per one million people across various global regions from 2018 to 2025, using data from The World Bank.
Surging Conflicts in Europe and the Middle East
Europe and Central Asia witnessed a dramatic rise in conflict events following Russia’s invasion of Ukraine in early 2022.
As seen in the table below, conflicts in the region have more than tripled from 4.6 conflicts per one million people in March of 2018 to 17.5 as of May 2025.
| Date | East Asia and Pacific (conflict events per 1M people) | Europe and Central Asia (conflict events per 1M people) | Latin America and the Caribbean (conflict events per 1M people) | Middle East and North Africa (conflict events per 1M people) | South Asia (conflict events per 1M people) | Sub-Saharan Africa (conflict events per 1M people) |
|---|---|---|---|---|---|---|
| March 2018 | 0.2 | 4.6 | 3.3 | 6.3 | 0.5 | 0.7 |
| April 2018 | 0.2 | 4.9 | 3.4 | 8.1 | 0.8 | 0.8 |
| July 2018 | 0.2 | 5.0 | 3.4 | 6.0 | 1.0 | 0.9 |
| October 2018 | 0.1 | 5.2 | 3.5 | 5.5 | 0.9 | 0.8 |
| January 2019 | 0.1 | 4.3 | 3.5 | 6.0 | 0.9 | 0.9 |
| April 2019 | 0.2 | 4.5 | 3.2 | 6.6 | 0.9 | 0.9 |
| July 2019 | 0.1 | 4.5 | 3.3 | 7.2 | 1.0 | 0.9 |
| October 2019 | 0.2 | 4.5 | 3.3 | 5.7 | 1.1 | 0.8 |
| January 2020 | 0.1 | 3.9 | 3.3 | 5.9 | 0.8 | 1.0 |
| April 2020 | 0.2 | 4.1 | 3.1 | 5.3 | 0.6 | 1.1 |
| July 2020 | 0.1 | 3.7 | 3.0 | 4.6 | 0.6 | 1.3 |
| October 2020 | 0.1 | 2.0 | 2.8 | 5.1 | 0.7 | 1.2 |
| January 2021 | 0.1 | 1.1 | 3.1 | 4.5 | 0.7 | 1.5 |
| April 2021 | 0.2 | 1.5 | 3.1 | 4.5 | 0.8 | 1.5 |
| July 2021 | 0.4 | 1.8 | 3.3 | 5.0 | 0.9 | 1.5 |
| October 2021 | 0.5 | 1.8 | 3.0 | 4.6 | 0.3 | 1.5 |
| January 2022 | 0.5 | 1.8 | 3.0 | 4.4 | 0.3 | 1.7 |
| April 2022 | 0.5 | 5.1 | 3.1 | 4.4 | 0.4 | 1.6 |
| July 2022 | 0.5 | 9.1 | 3.5 | 5.5 | 0.4 | 1.6 |
| October 2022 | 0.5 | 11.6 | 3.4 | 5.7 | 0.3 | 1.6 |
| January 2023 | 0.5 | 10.1 | 3.3 | 4.6 | 0.2 | 1.8 |
| April 2023 | 0.5 | 10.7 | 3.5 | 3.5 | 0.3 | 1.7 |
| July 2023 | 0.5 | 12.9 | 3.8 | 4.0 | 0.4 | 2.0 |
| October 2023 | 0.6 | 12.5 | 3.8 | 6.2 | 0.3 | 2.1 |
| January 2024 | 0.7 | 10.9 | 3.2 | 9.6 | 0.3 | 2.1 |
| April 2024 | 0.6 | 11.4 | 3.2 | 8.5 | 0.3 | 2.1 |
| July 2024 | 0.6 | 12.7 | 3.3 | 8.4 | 0.4 | 2.0 |
| October 2024 | 0.5 | 15.7 | 3.7 | 11.1 | 0.4 | 2.0 |
| January 2025 | 0.5 | 14.7 | 3.6 | 8.5 | 0.3 | 2.0 |
| April 2025 | 0.5 | 16.7 | 3.5 | 5.7 | 0.4 | 1.9 |
| May 2025 | 0.5 | 17.5 | 3.4 | 6.3 | 0.4 | 1.8 |
Russia’s invasion of Ukraine in February was a key ignition point, and by mid-2022, conflict intensity in this area surpassed most other regions.
The Middle East and North Africa consistently show high levels of conflict per capita, however, a notable surge occurred after the October 2023 Hamas attack on Israel.
This region has historically been prone to instability, but the recent spike underscores how fast tensions can escalate into widespread violence.
Lower Conflict Levels in East Asia and South Asia
Despite ongoing political complexities, regions like East Asia and the Pacific, along with South Asia, have maintained comparatively low conflict rates from 2018 to 2025.
While these areas face challenges and geopolitical tension especially around China and Taiwan, they have avoided the intense flashpoints that ignite higher levels of conflict.
Learn More on the Voronoi App 
To learn more about conflicts around the world, check out this graphic on Voronoi which maps out the world’s lesser-known armed conflicts.

Keep track of your essentials with the Apple AirTag 4 Pack, the ultimate tracking solution for your belongings. With over 5,972 ratings and a stellar 4.7-star average, this product has quickly become a customer favorite. Over 10,000 units were purchased in the past month, solidifying its status as a highly rated Amazon Choice product.
For just $79.98, you can enjoy peace of mind knowing your items are always within reach. Order now for only $79.98 at Amazon!
Help Power Techcratic’s Future – Scan To Support
If Techcratic’s content and insights have helped you, consider giving back by supporting the platform with crypto. Every contribution makes a difference, whether it’s for high-quality content, server maintenance, or future updates. Techcratic is constantly evolving, and your support helps drive that progress.
As a solo operator who wears all the hats, creating content, managing the tech, and running the site, your support allows me to stay focused on delivering valuable resources. Your support keeps everything running smoothly and enables me to continue creating the content you love. I’m deeply grateful for your support, it truly means the world to me! Thank you!
|
BITCOIN
bc1qlszw7elx2qahjwvaryh0tkgg8y68enw30gpvge Scan the QR code with your crypto wallet app |
|
DOGECOIN
D64GwvvYQxFXYyan3oQCrmWfidf6T3JpBA Scan the QR code with your crypto wallet app |
|
ETHEREUM
0xe9BC980DF3d985730dA827996B43E4A62CCBAA7a Scan the QR code with your crypto wallet app |


Please read the Privacy and Security Disclaimer on how Techcratic handles your support.
Disclaimer: As an Amazon Associate, Techcratic may earn from qualifying purchases.


