


Pallavi Rao
2025-08-25 10:44:00
www.visualcapitalist.com
Ranked: Top 40 Countries With the Most Calories per Person
This was originally posted on our Voronoi app. Download the app for free on iOS or Android and discover incredible data-driven charts from a variety of trusted sources.
Key Takeaways
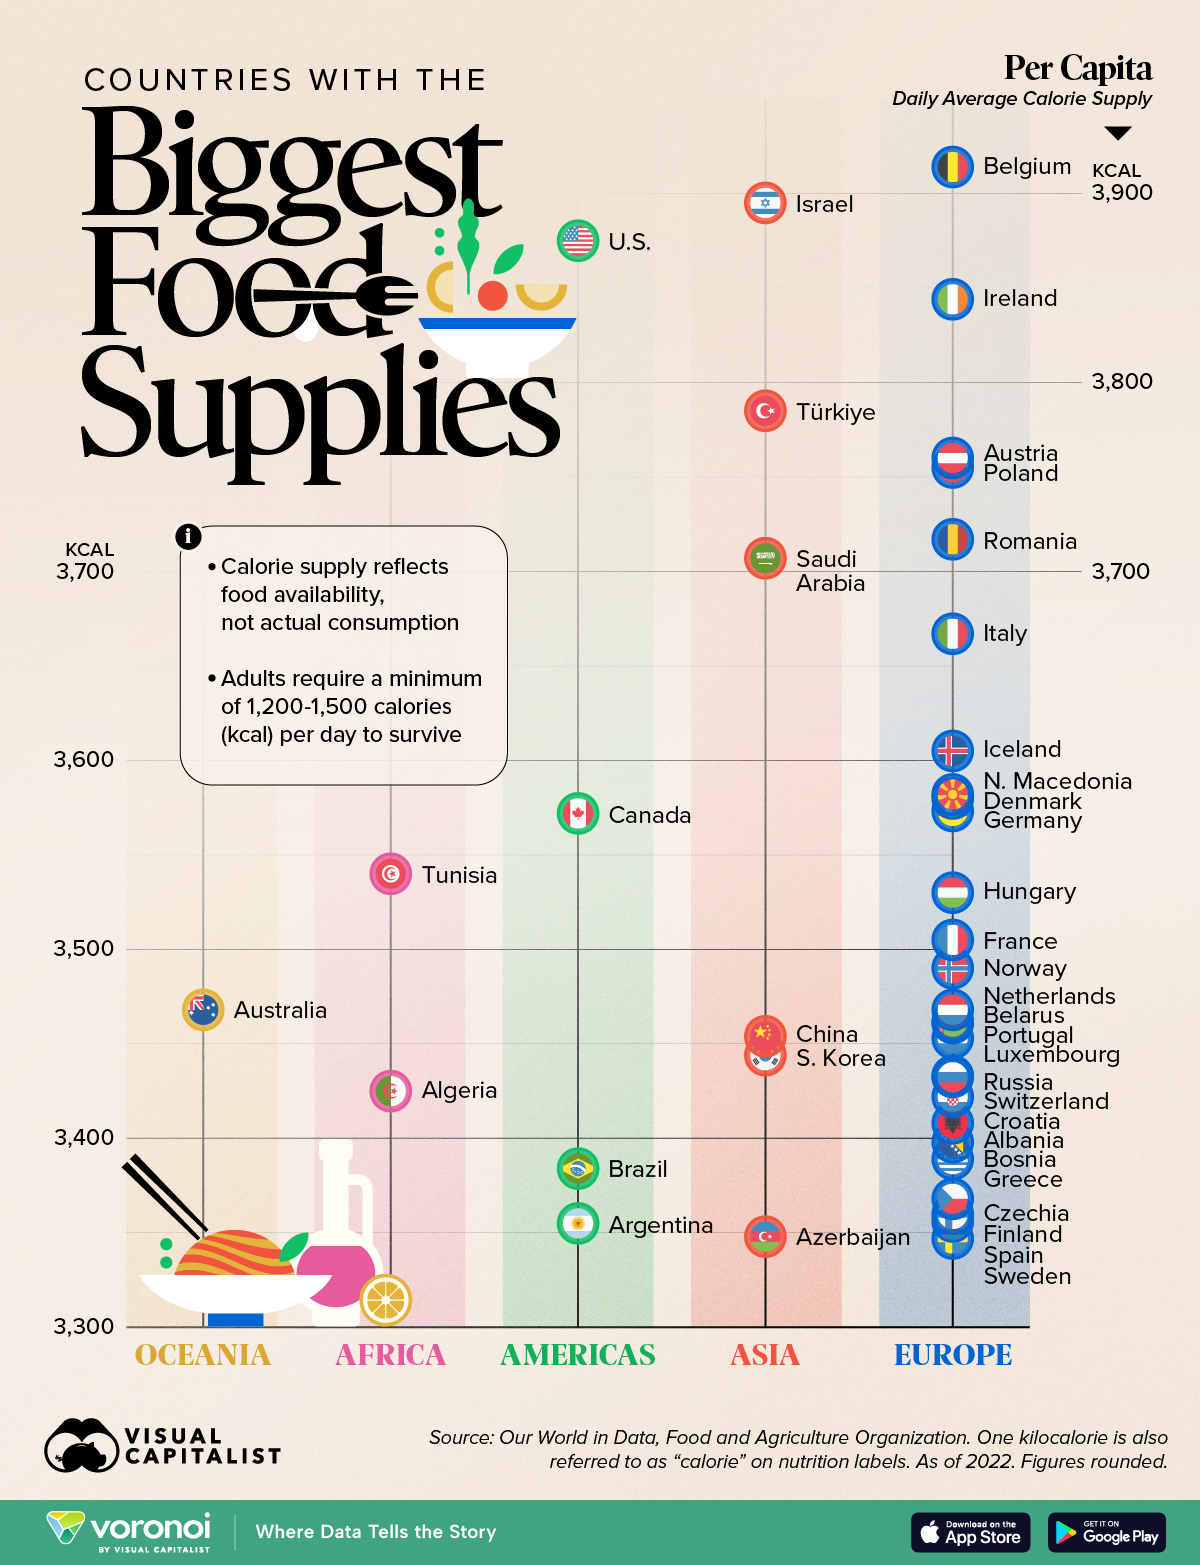
- Belgium tops the list of countries with the highest food supply at 3,914 calories per capita every day, followed by Israel (3,895 kcal) and the U.S. (3,875 kcal).
- These figures measure overall food supply and do not account for distribution or plate waste, so the average calories actually consumed are likely lower.
Why count calories at the national level?
Average daily food supply is a snapshot of a country’s entire food system: crop yields, imports, subsidies, and consumer preferences.
When availability climbs well above the 2,000–2,500 calories (kcal) most adults need, it can foreshadow rising public-health costs such as obesity, diabetes, and cardiovascular disease.
Conversely, a lower figure flags lingering food insecurity or supply-chain gaps.
This infographic ranks the top 40 countries with the largest food supplies.
Data for this visualization come from Our World in Data. They processed 2022 figures from the UN to track the average daily calories in a country’s food output, a measure that factors in imports and local production.
Because the metric captures supply rather than plate-level intake, it also hints at the scale of food lost in retail and households, an often-overlooked environmental cost.
Ranked: The Best-Fed Countries
Belgium leads the list with supplying nearly 3,900 kcal per person each day, fueled by calorie-dense staples such as bread, cheese, and chocolate.
| Rank | Country | Region | Per capita, daily average calorie supply (2022, kcal) |
|---|---|---|---|
| 1 | 🇧🇪Belgium | Europe | 3,914 |
| 2 | 🇮🇱Israel | Asia | 3,895 |
| 3 | 🇺🇸U.S. | Americas | 3,875 |
| 4 | 🇮🇪Ireland | Europe | 3,844 |
| 5 | 🇹🇷Türkiye | Asia | 3,785 |
| 6 | 🇦🇹Austria | Europe | 3,760 |
| 7 | 🇵🇱Poland | Europe | 3,755 |
| 8 | 🇷🇴Romania | Europe | 3,717 |
| 9 | 🇸🇦Saudi Arabia | Asia | 3,707 |
| 10 | 🇮🇹Italy | Europe | 3,667 |
| 11 | 🇮🇸Iceland | Europe | 3,605 |
| 12 | 🇲🇰North Macedonia | Europe | 3,582 |
| 13 | 🇩🇰Denmark | Europe | 3,580 |
| 14 | 🇩🇪Germany | Europe | 3,573 |
| 15 | 🇨🇦Canada | Americas | 3,572 |
| 16 | 🇹🇳Tunisia | Africa | 3,540 |
| 17 | 🇭🇺Hungary | Europe | 3,530 |
| 18 | 🇫🇷France | Europe | 3,505 |
| 19 | 🇳🇴Norway | Europe | 3,490 |
| 20 | 🇳🇱Netherlands | Europe | 3,468 |
| 21 | 🇦🇺Australia | Oceania | 3,468 |
| 22 | 🇧🇾Belarus | Europe | 3,462 |
| 23 | 🇵🇹Portugal | Europe | 3,461 |
| 24 | 🇨🇳China | Asia | 3,454 |
| 25 | 🇱🇺Luxembourg | Europe | 3,453 |
| 26 | 🇰🇷South Korea | Asia | 3,444 |
| 27 | 🇷🇺Russia | Europe | 3,433 |
| 28 | 🇨🇭Switzerland | Europe | 3,432 |
| 29 | 🇩🇿Algeria | Africa | 3,425 |
| 30 | 🇭🇷Croatia | Europe | 3,422 |
| 31 | 🇦🇱Albania | Europe | 3,408 |
| 32 | 🇧🇦Bosnia and Herzegovina | Europe | 3,398 |
| 33 | 🇬🇷Greece | Europe | 3,389 |
| 34 | 🇧🇷Brazil | Americas | 3,384 |
| 35 | 🇨🇿Czechia | Europe | 3,368 |
| 36 | 🇫🇮Finland | Europe | 3,360 |
| 37 | 🇪🇸Spain | Europe | 3,356 |
| 38 | 🇦🇷Argentina | Americas | 3,355 |
| 39 | 🇦🇿Azerbaijan | Asia | 3,348 |
| 40 | 🇸🇪Sweden | Europe | 3,347 |
Ireland, Austria, and Poland also exceed 3,750 kcal.
A long tradition of livestock farming and generous agricultural subsidies keep high-calorie animal products abundant and affordable.
In fact, Europe dominates these rankings, taking 27 of the 40 spots.
Yet high supply does not always translate into higher consumption.
Countries like France show signs of shifting toward lighter meals and smaller portion sizes despite steady supply growth.
As European Union policymakers focus on food waste targets, the gap between available and eaten calories could widen even further.
The Very Large North American diet
Outside Europe, Israel ranks a close second with 3,895 kcal, reflecting a diet that blends Western processed foods with regional favorites such as tahini and olive oil.
The U.S. lands in third place at 3,875 kcal, underscoring its expansive agricultural system and large portion norms.
Saudi Arabia’s ninth-place finish (3,707 kcal) is noteworthy. A heavy dependence on food imports and government-backed food subsidies help maintain one of the world’s most calorie-rich supplies despite limited arable land.
However, high availability often correlates with rising obesity rates.
Adult obesity now exceeds 30% in both the U.S. and Saudi Arabia, highlighting the health trade-offs of abundant food systems.
Why Food Supply Does Not Equal Calorie Intake
Food supply figures overstate actual consumption because they do not subtract retail losses and household waste.
In high income countries, roughly one-third of edible calories never reach the plate.
Even so, surplus supply strains ecosystems through land use, water withdrawals, and greenhouse-gas emissions.
Recent studies estimate that cutting global food waste in half could lower agricultural emissions by up to 8%.
Conversely, for lower-supply nations, modest gains in food availability remain critical for combating under-nutrition.
Understanding the distinction between calories supplied and calories eaten helps policymakers craft targeted dietary guidelines, waste-reduction programs, and social safety nets.
Learn More on the Voronoi App 
If you enjoyed today’s post, check out Top 50 Countries That Can Feed Themselves Across Seven Food Groups on Voronoi, the new app from Visual Capitalist.
Keep track of your essentials with the Apple AirTag 4 Pack, the ultimate tracking solution for your belongings. With over 5,972 ratings and a stellar 4.7-star average, this product has quickly become a customer favorite. Over 10,000 units were purchased in the past month, solidifying its status as a highly rated Amazon Choice product.
For just $79.98, you can enjoy peace of mind knowing your items are always within reach. Order now for only $79.98 at Amazon!
Help Power Techcratic’s Future – Scan To Support
If Techcratic’s content and insights have helped you, consider giving back by supporting the platform with crypto. Every contribution makes a difference, whether it’s for high-quality content, server maintenance, or future updates. Techcratic is constantly evolving, and your support helps drive that progress.
As a solo operator who wears all the hats, creating content, managing the tech, and running the site, your support allows me to stay focused on delivering valuable resources. Your support keeps everything running smoothly and enables me to continue creating the content you love. I’m deeply grateful for your support, it truly means the world to me! Thank you!
|
BITCOIN
bc1qlszw7elx2qahjwvaryh0tkgg8y68enw30gpvge Scan the QR code with your crypto wallet app |
|
DOGECOIN
D64GwvvYQxFXYyan3oQCrmWfidf6T3JpBA Scan the QR code with your crypto wallet app |
|
ETHEREUM
0xe9BC980DF3d985730dA827996B43E4A62CCBAA7a Scan the QR code with your crypto wallet app |


Please read the Privacy and Security Disclaimer on how Techcratic handles your support.
Disclaimer: As an Amazon Associate, Techcratic may earn from qualifying purchases.


