


![[01_Odyssey] Generative art Exhibition – Dark Room Experience](https://techcratic.com/wp-content/uploads/2025/09/1758190693_maxresdefault-360x180.jpg)


Niccolo Conte
2025-09-18 10:29:00
www.visualcapitalist.com
Visualized: The Top Countries Buying U.S. Oil in 2024
This was originally posted on our Voronoi app. Download the app for free on iOS or Android and discover incredible data-driven charts from a variety of trusted sources.
Key Takeaways
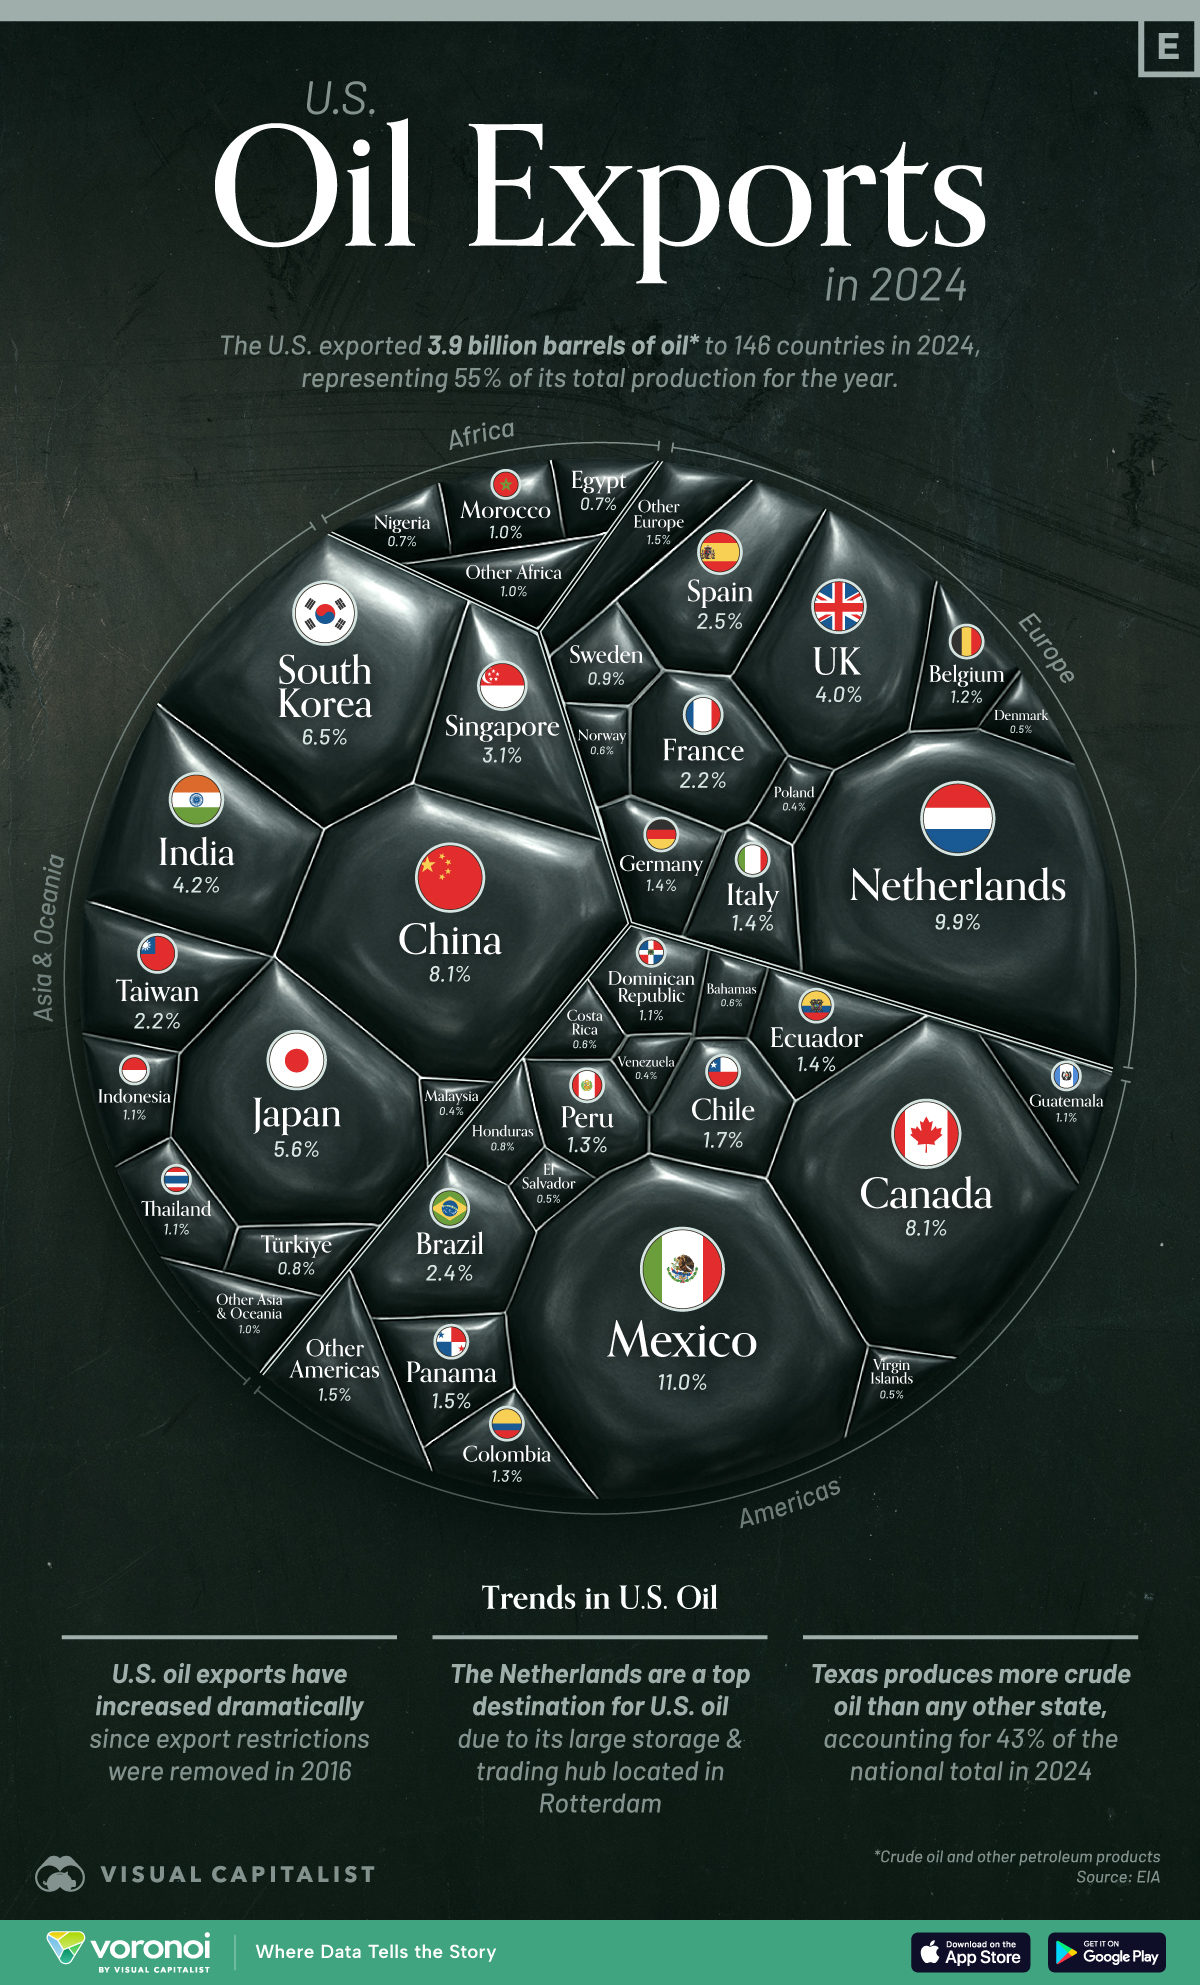
- The U.S. exported 3.9 billion barrels of oil to 146 countries in 2024, representing 55% of its domestic production
- The top destinations were: Mexico (11.0%), the Netherlands (9.9%), Canada (8.1%) and China (8.1%)
The U.S. is one of the world’s largest oil producers and exporters. In 2024, the country shipped nearly 4 billion barrels of oil abroad, accounting for more than half of U.S. production that year. This flow of crude, refined products, and other liquids highlights the global importance of American energy.
This visualization breaks down the top countries buying U.S. oil last year. The data for this visualization comes from the U.S. Energy Information Administration (EIA). It tracks all petroleum and liquid fuel exports, measured in barrels.
North America Leads U.S. Oil Imports
Mexico topped the list of importers, receiving 429 million barrels, or 11% of all U.S. oil exports. Canada followed closely, importing over 316 million barrels (8.1%).
| Rank | 2024 Exports | Barrels | % of Total |
|---|---|---|---|
| 1 | Mexico | 429,192,000 | 11.0 |
| 2 | Netherlands | 387,659,000 | 9.9 |
| 3 | China | 318,166,000 | 8.1 |
| 4 | Canada | 316,498,000 | 8.1 |
| 5 | Korea | 255,126,000 | 6.5 |
| 6 | Japan | 219,421,000 | 5.6 |
| 7 | India | 164,200,000 | 4.2 |
| 8 | UK | 158,044,000 | 4.0 |
| 9 | Singapore | 120,041,000 | 3.1 |
| 10 | Spain | 99,384,000 | 2.5 |
| 11 | Brazil | 94,411,000 | 2.4 |
| 12 | Taiwan | 86,381,000 | 2.2 |
| 13 | France | 84,471,000 | 2.2 |
| 14 | Chile | 65,211,000 | 1.7 |
| 15 | Panama | 58,725,000 | 1.5 |
| 16 | Italy | 56,514,000 | 1.4 |
| 17 | Ecuador | 54,976,000 | 1.4 |
| 18 | Germany | 53,155,000 | 1.4 |
| 19 | Colombia | 50,531,000 | 1.3 |
| 20 | Peru | 49,678,000 | 1.3 |
| 21 | Belgium | 46,951,000 | 1.2 |
| 22 | Dominican Republic | 44,668,000 | 1.1 |
| 23 | Indonesia | 44,257,000 | 1.1 |
| 24 | Thailand | 43,488,000 | 1.1 |
| 25 | Guatemala | 43,454,000 | 1.1 |
| 26 | Morocco | 38,423,000 | 1.0 |
| 27 | Sweden | 35,646,000 | 0.9 |
| 28 | Turkiye | 33,263,000 | 0.8 |
| 29 | Honduras | 29,497,000 | 0.8 |
| 30 | Egypt | 27,734,000 | 0.7 |
| 31 | Nigeria | 26,236,000 | 0.7 |
| 32 | Norway | 25,381,000 | 0.6 |
| 33 | Bahama Islands | 23,687,000 | 0.6 |
| 34 | Costa Rica | 22,551,000 | 0.6 |
| 35 | Denmark | 19,275,000 | 0.5 |
| 36 | Virgin Islands | 19,176,000 | 0.5 |
| 37 | El Salvador | 18,660,000 | 0.5 |
| 38 | Venezuela | 17,575,000 | 0.4 |
| 39 | Poland | 16,760,000 | 0.4 |
| 40 | Malaysia | 16,493,000 | 0.4 |
| 41 | Portugal | 13,089,000 | 0.3 |
| 42 | Ireland | 13,054,000 | 0.3 |
| 43 | South Africa | 12,701,000 | 0.3 |
| 44 | Australia | 11,484,000 | 0.3 |
| 45 | Finland | 10,694,000 | 0.3 |
| 46 | Argentina | 10,556,000 | 0.3 |
| 47 | Nicaragua | 10,333,000 | 0.3 |
| 48 | Trinidad & Tobago | 10,323,000 | 0.3 |
| 49 | Kenya | 7,620,000 | 0.2 |
| 50 | Jamaica | 7,490,000 | 0.2 |
| 51 | Saint Lucia | 6,429,000 | 0.2 |
| 52 | Cote d’Ivore | 6,349,000 | 0.2 |
| 53 | Bangladesh | 6,281,000 | 0.2 |
| 54 | Switzerland | 5,915,000 | 0.2 |
| 55 | Greece | 5,333,000 | 0.1 |
| 56 | Ghana | 4,381,000 | 0.1 |
| 57 | Gibraltar | 4,256,000 | 0.1 |
| 58 | Vietnam | 4,252,000 | 0.1 |
| 59 | Curacao | 3,986,000 | 0.1 |
| 60 | Puerto Rico | 3,882,000 | 0.1 |
| 61 | Uruguay | 3,681,000 | 0.1 |
| 62 | Philippines | 3,618,000 | 0.1 |
| 63 | Israel | 3,239,000 | 0.1 |
| 64 | Togo | 2,637,000 | 0.1 |
| 65 | UAE | 2,112,000 | 0.1 |
| 66 | Jordan | 2,108,000 | 0.1 |
| 67 | Oman | 2,054,000 | 0.1 |
| 68 | Belize | 1,842,000 | 0.0 |
| 69 | Haiti | 1,744,000 | 0.0 |
| 70 | Bulgaria | 1,634,000 | 0.0 |
| 71 | Aruba | 1,608,000 | 0.0 |
| 72 | Senegal | 1,437,000 | 0.0 |
| 73 | Cayman Islands | 1,326,000 | 0.0 |
| 74 | Paraguay | 1,128,000 | 0.0 |
| 75 | Saudi Arabia | 969,000 | 0.0 |
| 76 | Bolivia | 927,000 | 0.0 |
| 77 | Iceland | 909,000 | 0.0 |
| 78 | Liberia | 884,000 | 0.0 |
| 79 | Antigua & Barbuda | 844,000 | 0.0 |
| 80 | New Zealand | 844,000 | 0.0 |
| 81 | Mozambique | 841,000 | 0.0 |
| 82 | Guadeloupe | 775,000 | 0.0 |
| 83 | Latvia | 709,000 | 0.0 |
| 84 | Tunisia | 655,000 | 0.0 |
| 85 | Slovenia | 560,000 | 0.0 |
| 86 | Pakistan | 502,000 | 0.0 |
| 87 | Romania | 489,000 | 0.0 |
| 88 | Namibia | 440,000 | 0.0 |
| 89 | Kuwait | 422,000 | 0.0 |
| 90 | Hong Kong | 412,000 | 0.0 |
| 91 | Albania | 370,000 | 0.0 |
| 92 | Croatia | 356,000 | 0.0 |
| 93 | Barbados | 343,000 | 0.0 |
| 94 | Benin | 326,000 | 0.0 |
| 95 | Turks and Caicos Islands | 326,000 | 0.0 |
| 96 | Cameroon | 320,000 | 0.0 |
| 97 | Guinea | 289,000 | 0.0 |
| 98 | Central African Republic | 266,000 | 0.0 |
| 99 | Tanzania | 264,000 | 0.0 |
| 100 | Djibouti | 259,000 | 0.0 |
| 101 | Lithuania | 244,000 | 0.0 |
| 102 | Qatar | 188,000 | 0.0 |
| 103 | Martinique | 161,000 | 0.0 |
| 104 | Guyana | 153,000 | 0.0 |
| 105 | British Virgin Islands | 129,000 | 0.0 |
| 106 | Lebanon | 123,000 | 0.0 |
| 107 | Algeria | 102,000 | 0.0 |
| 108 | Macedonia | 99,000 | 0.0 |
| 109 | Madagascar | 99,000 | 0.0 |
| 110 | Cyprus | 89,000 | 0.0 |
| 111 | Iraq | 71,000 | 0.0 |
| 112 | Bermuda | 47,000 | 0.0 |
| 113 | Suriname | 47,000 | 0.0 |
| 114 | Angola | 41,000 | 0.0 |
| 115 | Cuba | 34,000 | 0.0 |
| 116 | Marshall Islands | 22,000 | 0.0 |
| 117 | Czechia | 12,000 | 0.0 |
| 118 | Uganda | 11,000 | 0.0 |
| 119 | Libya | 10,000 | 0.0 |
| 120 | Sint Maarten | 9,000 | 0.0 |
| 121 | Saint Kitts and Nevis | 8,000 | 0.0 |
| 122 | Kazakhstan | 6,000 | 0.0 |
| 123 | Saint Vincent and the Grenadines | 5,000 | 0.0 |
| 124 | Uzbekistan | 5,000 | 0.0 |
| 125 | Georgia | 4,000 | 0.0 |
| 126 | Ukraine | 4,000 | 0.0 |
| 127 | Anguilla | 3,000 | 0.0 |
| 128 | Bahrain | 3,000 | 0.0 |
| 129 | Grenada | 3,000 | 0.0 |
| 130 | Kyrgyzstan | 3,000 | 0.0 |
| 131 | Dominica | 2,000 | 0.0 |
| 132 | Equatorial Guinea | 2,000 | 0.0 |
| 133 | Hungary | 2,000 | 0.0 |
| 134 | Mongolia | 2,000 | 0.0 |
| 135 | Austria | 1,000 | 0.0 |
| 136 | Azerbaijan | 1,000 | 0.0 |
| 137 | Cambodia | 1,000 | 0.0 |
| 138 | Estonia | 1,000 | 0.0 |
| 139 | Eswatini | 1,000 | 0.0 |
| 140 | Ethiopia | 1,000 | 0.0 |
| 141 | French Polynesia | 1,000 | 0.0 |
| 142 | Federated States | 1,000 | 0.0 |
| 143 | Monaco | 1,000 | 0.0 |
| 144 | Montserrat | 1,000 | 0.0 |
| 145 | Papua New Guinea | 1,000 | 0.0 |
| 146 | Russia | 1,000 | 0.0 |
| Total | 3,919,330,000 | 100.0 |
Europe and Asia Are Key Markets
The Netherlands was the second-largest buyer, taking in 387 million barrels (9.9%), while other major European buyers included the UK, Spain, and France. These exports often serve as inputs for refining hubs or redistribution across the continent.
Meanwhile, Asian countries such as China, South Korea, Japan, and India also ranked highly—each importing over 150 million barrels.
Broad Global Reach
While the top 10 countries accounted for a majority of exports, U.S. oil reached almost 150 countries. Even smaller nations like Togo, Belize, and Latvia made the list.
Why Does the U.S. Export Oil While Still Importing It?
At first glance, it may seem contradictory for the U.S. to export over half of its oil production while continuing to import oil, especially from Canada. But this is a result of differences in crude oil types, refinery configurations, and global market dynamics.
Most U.S. oil production is light, sweet crude, while many American refineries were built to handle heavier, sour grades. Additionally, some U.S. refineries are located closer to foreign markets than to domestic demand centers. As a result, oil flows both in and out of the country to optimize refining efficiency, logistics, and economic returns.
In total, 55% of U.S. oil production was exported.
Learn More on the Voronoi App 
If you enjoyed today’s post, check out The Top Countries Buying U.S. Coal in 2024 on Voronoi, the new app from Visual Capitalist.

Keep track of your essentials with the Apple AirTag 4 Pack, the ultimate tracking solution for your belongings. With over 5,972 ratings and a stellar 4.7-star average, this product has quickly become a customer favorite. Over 10,000 units were purchased in the past month, solidifying its status as a highly rated Amazon Choice product.
For just $79.98, you can enjoy peace of mind knowing your items are always within reach. Order now for only $79.98 at Amazon!
Help Power Techcratic’s Future – Scan To Support
If Techcratic’s content and insights have helped you, consider giving back by supporting the platform with crypto. Every contribution makes a difference, whether it’s for high-quality content, server maintenance, or future updates. Techcratic is constantly evolving, and your support helps drive that progress.
As a solo operator who wears all the hats, creating content, managing the tech, and running the site, your support allows me to stay focused on delivering valuable resources. Your support keeps everything running smoothly and enables me to continue creating the content you love. I’m deeply grateful for your support, it truly means the world to me! Thank you!
|
BITCOIN
bc1qlszw7elx2qahjwvaryh0tkgg8y68enw30gpvge Scan the QR code with your crypto wallet app |
|
DOGECOIN
D64GwvvYQxFXYyan3oQCrmWfidf6T3JpBA Scan the QR code with your crypto wallet app |
|
ETHEREUM
0xe9BC980DF3d985730dA827996B43E4A62CCBAA7a Scan the QR code with your crypto wallet app |


Please read the Privacy and Security Disclaimer on how Techcratic handles your support.
Disclaimer: As an Amazon Associate, Techcratic may earn from qualifying purchases.


