


![[FREE] HARD TRAP TYPE BEAT “AREA 51” prod. 9NLC](https://techcratic.com/wp-content/uploads/2024/05/1715921823_maxresdefault-360x180.jpg)
Pallavi Rao
2023-10-07 17:02:21
www.visualcapitalist.com
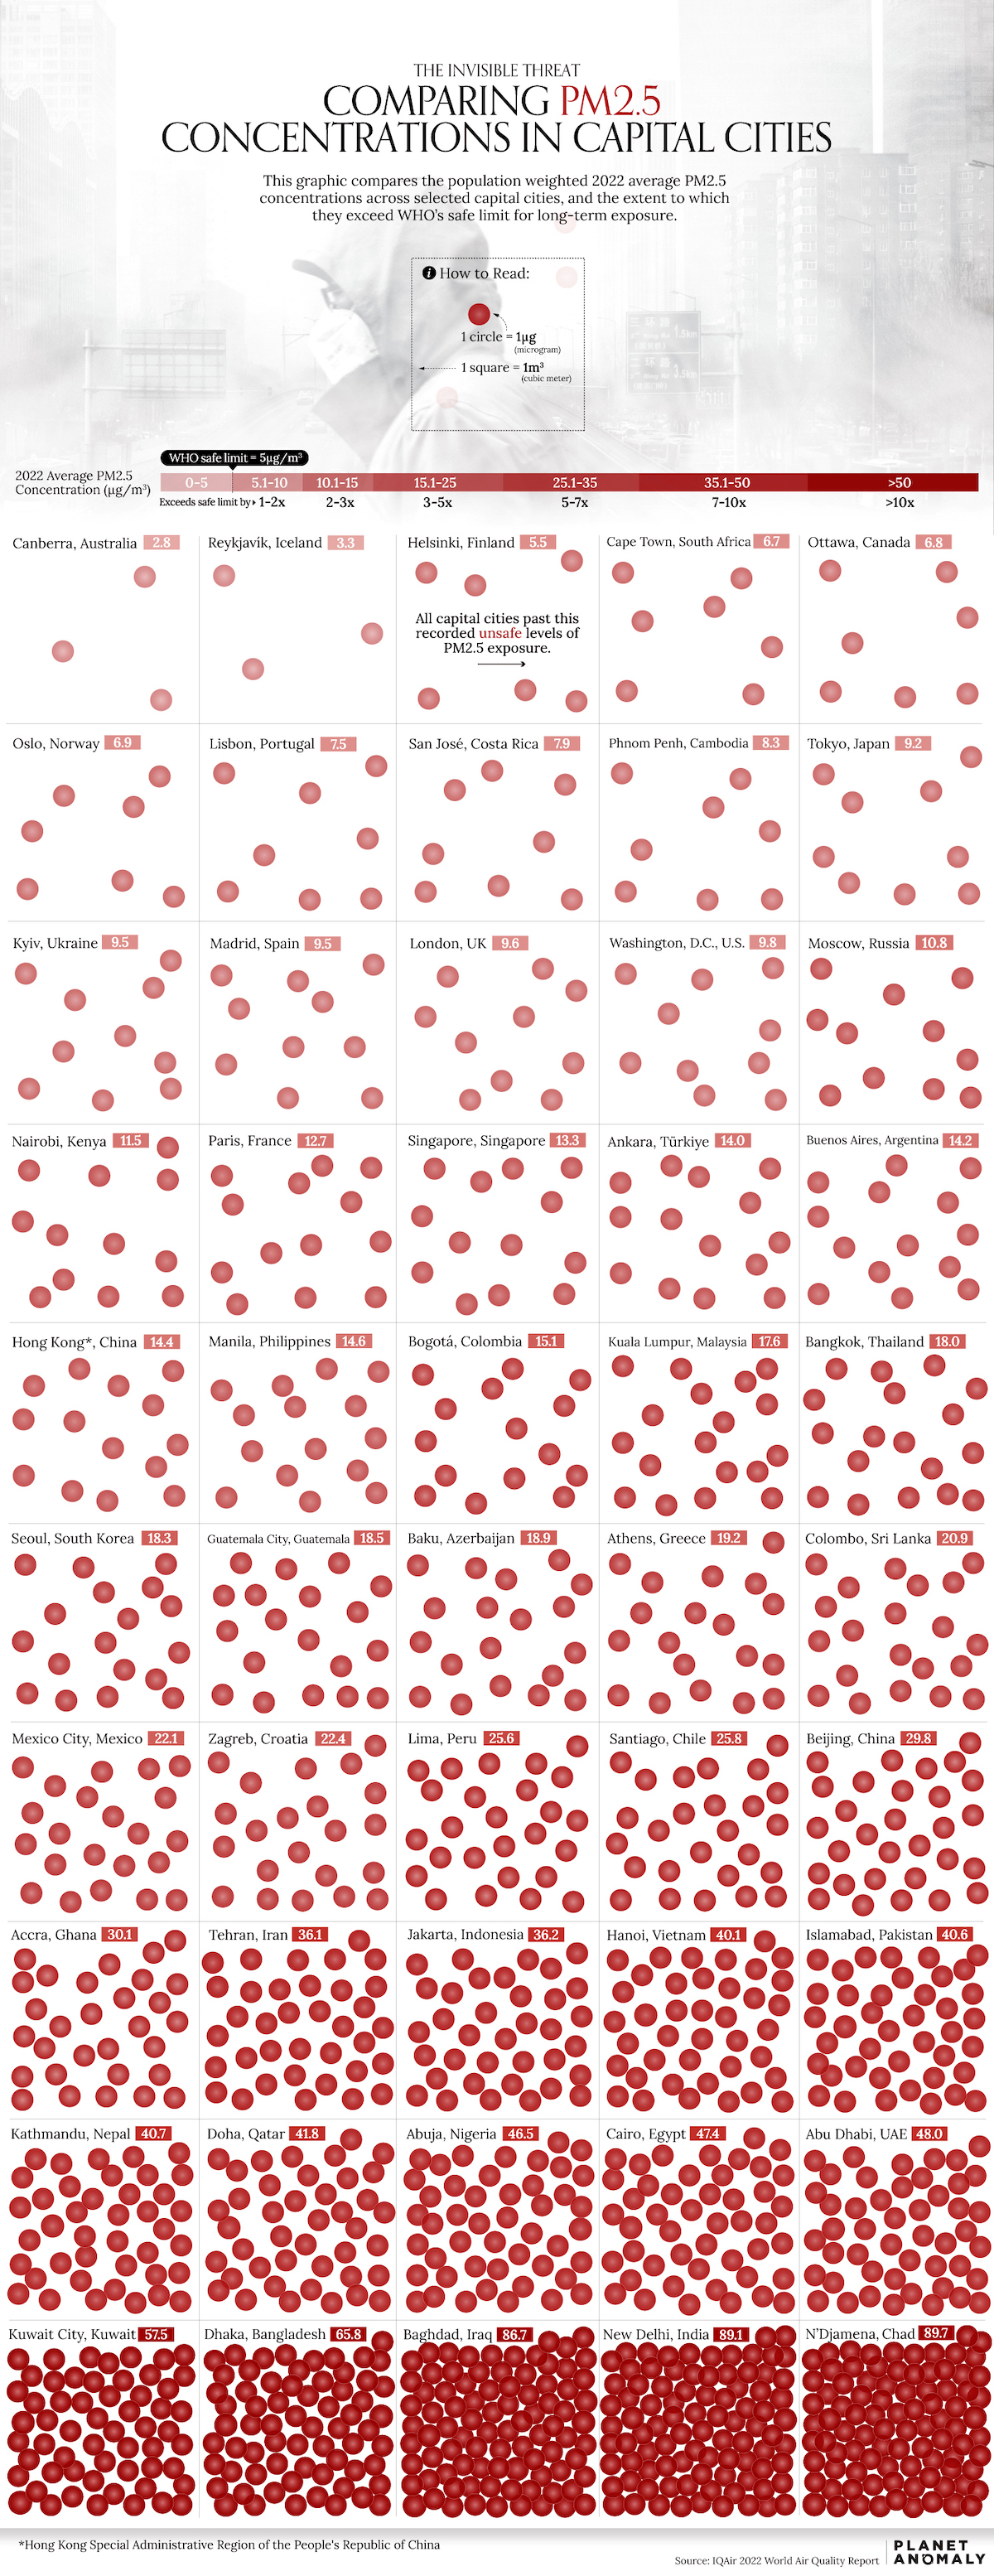
Comparing Air Quality and Pollution in 50 Capital Cities
We know bad air quality when we breathe it in—but how does it measure and compare across different cities?
To assess air quality, agencies measure the amount of particulate matter in an area to arrive at a number the resident population is breathing in over a period of time.
 Airborne particulate matter (PM) is a complex mix of solids and aerosols and is defined by diameter for regulatory purposes. Particles with a diameter of 10 microns or less (PM10) are inhalable and can induce adverse health effects.
In this case, Planet Anomaly visualized the concentration of PM2.5 (fine particulate matter) in 50 select capital cities across the globe, using data from IQAir’s 2022 World Air Quality Report.
The report applied population-based adjustments to standardize its results and calculated an annual average of the data. If a city exceeded the WHO safety guideline of 5 micrograms per cubic meter (μg/m³) for annual average PM2.5 levels, it implied potential health risks for its residents.
Ranked: Capital Cities With the Best and Worst Air Quality
At the top of the list with the best air quality, Canberra, the capital of Australia, had an average PM2.5 level of 2.8 μg/m³ in 2022. Vehicle emissions and dust storms are the few sources of air pollutants in the city.
However, while Canberra did well in 2022, it had some of the worst air quality in 2020 when bushfire smoke blackened the skies.
Here’s the full list of all 116 capital cities measured by IQAir’s report, ranked by air quality from best to worst.
| Rank | City | Country | Region | 2022 Average PM2.5 Concentration |
|---|---|---|---|---|
| 1 | Canberra |  Australia Australia |
Oceania | 2.8 |
| 2 | Hamilton |  Bermuda Bermuda |
North America | 3.0 |
| 3 | Reykjavik |  Iceland Iceland |
Europe | 3.3 |
| 4 | San Juan |  Puerto Rico Puerto Rico |
North America | 3.3 |
| 5 | Noumea |  New Caledonia New Caledonia |
Oceania | 3.5 |
| 6 | Saint George’s |  Grenada Grenada |
Central America | 3.8 |
| 7 | Tallinn |  Estonia Estonia |
Europe | 4.8 |
| 8 | Port of Spain |  Trinidad & Tobago Trinidad & Tobago |
Central America | 5.0 |
| 9 | Helsinki |  Finland Finland |
Europe | 5.5 |
| 10 | Cape Town |  South Africa South Africa |
Africa | 6.7 |
| 11 | Ottawa |  Canada Canada |
North America | 6.8 |
| 12 | Stockholm |  Sweden Sweden |
Europe | 6.8 |
| 13 | Oslo |  Norway Norway |
Europe | 6.9 |
| 14 | Paramaribo |  Suriname Suriname |
South America | 7.0 |
| 15 | Dublin |  Ireland Ireland |
Europe | 7.1 |
| 16 | La Paz |  Bolivia Bolivia |
South America | 7.3 |
| 17 | Lisbon |  Portugal Portugal |
Europe | 7.5 |
| 18 | San Jose |  Costa Rica Costa Rica |
Central America | 7.9 |
| 19 | Phnom Penh |  Cambodia Cambodia |
Asia | 8.3 |
| 20 | Vaduz |  Liechtenstein Liechtenstein |
Europe | 8.3 |
| 21 | Copenhagen |  Denmark Denmark |
Europe | 8.7 |
| 22 | Luanda |  Angola Angola |
Africa | 8.8 |
| 23 | Managua |  Nicaragua Nicaragua |
Central America | 8.9 |
| 24 | Panama |  Panama Panama |
Central America | 9.0 |
| 25 | Tokyo |  Japan Japan |
Asia | 9.2 |
| 26 | Madrid |  Spain Spain |
Europe | 9.5 |
| 27 | Kyiv |  Ukraine Ukraine |
Europe | 9.5 |
| 28 | London |  UK UK |
Europe | 9.6 |
| 29 | Washington |  U.S. U.S. |
North America | 9.8 |
| 30 | Taipei |  Taiwan Taiwan |
Asia | 9.9 |
| 31 | Amsterdam |  Netherlands Netherlands |
Europe | 10.1 |
| 32 | Tegucigalpa |  Honduras Honduras |
Central America | 10.2 |
| 33 | Vienna |  Austria Austria |
Europe | 10.5 |
| 34 | Bern |  Switzerland Switzerland |
Europe | 10.5 |
| 35 | Brussels |  Belgium Belgium |
Europe | 10.6 |
| 36 | Moscow |  Russia Russia |
Europe | 10.8 |
| 37 | Budapest |  Hungary Hungary |
Europe | 11.2 |
| 38 | Montevideo |  Uruguay Uruguay |
South America | 11.3 |
| 39 | Nairobi |  Kenya Kenya |
Africa | 11.5 |
| 40 | Podgorica |  Montenegro Montenegro |
Europe | 11.8 |
| 41 | Prague |  Czech Republic Czech Republic |
Europe | 11.9 |
| 42 | Berlin |  Germany Germany |
Europe | 12.6 |
| 43 | Rome |  Italy Italy |
Europe | 12.6 |
| 44 | Paris |  France France |
Europe | 12.7 |
| 45 | Georgetown |  Guyana Guyana |
South America | 12.7 |
| 46 | Singapore |  Singapore Singapore |
Asia | 13.3 |
| 47 | San Salvador |  El Salvador El Salvador |
Central America | 13.4 |
| 48 | Bratislava |  Slovakia Slovakia |
Europe | 13.4 |
| 49 | Pristina |  Kosovo Kosovo |
Europe | 13.7 |
| 50 | Ankara |  Türkiye Türkiye |
Asia | 14.0 |
| 51 | Buenos Aires |  Argentina Argentina |
South America | 14.2 |
| 52 | Hong Kong |  Hong Kong SAR Hong Kong SAR |
Asia | 14.4 |
| 53 | Tirana |  Albania Albania |
Europe | 14.5 |
| 54 | Vilnius |  Lithuania Lithuania |
Europe | 14.5 |
| 55 | Metro Manila |  Philippines Philippines |
Asia | 14.6 |
| 56 | Bogota |  Colombia Colombia |
South America | 15.1 |
| 57 | Warsaw |  Poland Poland |
Europe | 15.3 |
| 58 | Kinshasa |  DRC DRC |
Africa | 15.5 |
| 59 | Ljubljana |  Slovenia Slovenia |
Europe | 16.2 |
| 60 | Tbilisi |  Georgia Georgia |
Europe | 16.3 |
| 61 | Nicosia |  Cyprus Cyprus |
Europe | 16.4 |
| 62 | Bucharest |  Romania Romania |
Europe | 17.1 |
| 63 | Kuala Lumpur |  Malaysia Malaysia |
Asia | 17.6 |
| 64 | Algiers |  Algeria Algeria |
Africa | 17.8 |
| 65 | Bangkok |  Thailand Thailand |
Asia | 18.0 |
| 66 | Seoul |  South Korea South Korea |
Asia | 18.3 |
| 67 | Guatemala City |  Guatemala Guatemala |
Central America | 18.5 |
| 68 | Baku |  Azerbaijan Azerbaijan |
Asia | 18.9 |
| 69 | Sofia |  Bulgaria Bulgaria |
Europe | 19.1 |
| 70 | Athens |  Greece Greece |
Europe | 19.2 |
| 71 | Tel Aviv-Yafo |  Israel Israel |
Middle East | 19.5 |
| 72 | Dakar |  Senegal Senegal |
Africa | 20.4 |
| 73 | Colombo |  Sri Lanka Sri Lanka |
Asia | 20.9 |
| 74 | Astana |  Kazakhstan Kazakhstan |
Asia | 21.4 |
| 75 | Ashgabat |  Turkmenistan Turkmenistan |
Asia | 21.6 |
| 76 | Mexico City |  Mexico Mexico |
North America | 22.1 |
| 77 | Belgrade |  Serbia Serbia |
Europe | 22.1 |
| 78 | Zagreb |  Croatia Croatia |
Europe | 22.4 |
| 79 | Abidjan |  Ivory Coast Ivory Coast |
Africa | 22.5 |
| 80 | Chisinau |  Moldova Moldova |
Europe | 22.6 |
| 81 | Antananarivo |  Madagascar Madagascar |
Africa | 23.7 |
| 82 | Yangon |  Myanmar Myanmar |
Asia | 24.3 |
| 83 | Lusaka |  Zambia Zambia |
Africa | 24.6 |
| 84 | Lima |  Peru Peru |
South America | 25.6 |
| 85 | Santiago |  Chile Chile |
South America | 25.8 |
| 86 | Skopje |  North Macedonia North Macedonia |
Europe | 26.6 |
| 87 | Vientiane |  Laos Laos |
Asia | 27.6 |
| 88 | Bishkek |  Kyrgyzstan Kyrgyzstan |
Asia | 29.0 |
| 89 | Beijing |  China China |
Asia | 29.8 |
| 90 | Accra |  Ghana Ghana |
Africa | 30.1 |
| 91 | Ulaanbaatar |  Mongolia Mongolia |
Asia | 30.6 |
| 92 | Addis Ababa |  Ethiopia Ethiopia |
Africa | 31.3 |
| 93 | Yerevan |  Armenia Armenia |
Asia | 31.4 |
| 94 | Sarajevo |  Bosnia Herzegovina Bosnia Herzegovina |
Europe | 32.4 |
| 95 | Tashkent |  Uzbekistan Uzbekistan |
Asia | 33.5 |
| 96 | Tehran |  Iran Iran |
Asia | 36.1 |
| 97 | Jakarta |  Indonesia Indonesia |
Asia | 36.2 |
| 98 | Kampala |  Uganda Uganda |
Africa | 39.6 |
| 99 | Hanoi |  Vietnam Vietnam |
Asia | 40.1 |
| 100 | Islamabad |  Pakistan Pakistan |
Asia | 40.6 |
| 101 | Kathmandu |  Nepal Nepal |
Asia | 40.7 |
| 102 | Doha |  Qatar Qatar |
Middle East | 41.8 |
| 103 | Kigali |  Rwanda Rwanda |
Africa | 44.0 |
| 104 | Khartoum |  Sudan Sudan |
Africa | 44.6 |
| 105 | Riyadh |  Saudi Arabia Saudi Arabia |
Middle East | 46.2 |
| 106 | Abuja |  Nigeria Nigeria |
Africa | 46.5 |
| 107 | Cairo |  Egypt Egypt |
Africa | 47.4 |
| 108 | Dushanbe |  Tajikistan Tajikistan |
Asia | 47.7 |
| 109 | Abu Dhabi |  UAE UAE |
Middle East | 48.0 |
| 110 | Kuwait City |  Kuwait Kuwait |
Middle East | 57.5 |
| 111 | Ougadougou |  Burkina Faso Burkina Faso |
Africa | 63.0 |
| 112 | Dhaka |  Bangladesh Bangladesh |
Asia | 65.8 |
| 113 | Manama |  Bahrain Bahrain |
Middle East | 66.6 |
| 114 | Baghdad |  Iraq Iraq |
Asia | 86.7 |
| 115 | New Delhi |  India India |
Asia | 89.1 |
| 116 | N’Djamena |  Chad Chad |
Africa | 89.7 |
Hamilton, Bermuda (3.8 μg/m³) and Reykjavik, Iceland (3.3 μg/m³) rank second and third respectively, followed by three more capitals on island nations. In fact, nine of the top 10 capitals are situated directly on a coastline and take advantage of ocean breezes that can act as air filters.
Ranked 8th, the Port of Spain (capital of Trinidad & Tobago) is the last city whose air quality is considered safe (5.0 μg/m³) by the WHO.
From a broader perspective, fewer than 10% of all countries have air quality that meets safety guidelines.
Meanwhile, at the bottom of the list with the worst air quality, Chad’s capital city N’Djamena, recorded a PM2.5 concentration of nearly 90 μg/m³ per day in 2022—almost 18x the recommended WHO safety guideline.
Air Quality Correlates With Countries’ Income Levels
Perhaps the most striking feature of the rankings is how air quality worsens with countries that are in the low and middle-income categories and improves in high income countries.
As an example, compare the distribution of the ranks of capital cities in Asia (generally lower and middle income countries) versus capitals in Europe (general high income countries).
| Air Quality Ranks | Cities in Asia | Cities in Europe |
|---|---|---|
| Top 20 | 3.33% | 20.51% |
| 20–40 | 6.67% | 28.21% |
| 40–60 | 13.33% | 28.21% |
| 60–80 | 23.33% | 17.95% |
| 80–100 | 36.67% | 5.13% |
| 100–116 | 16.67% | 0.00% |
The majority of European capital cities are ranked 20–60 versus Asian capitals which are mostly ranked 60–100.
Lower and middle income countries have larger structural economic concerns and many of them are still in the process of transitioning away from polluting materials that affect air quality.
The post Visualized: Air Quality and Pollution in 50 Capital Cities appeared first on Visual Capitalist.


