


Omri Wallach
2024-03-09 14:46:19
www.visualcapitalist.com
Mānuka Honey and the Global Honey Trade
Did you know that the honey export industry today is worth billions?
Over the past two decades, the demand for this sought-after pantry staple has grown across industries ranging from skincare to medicine.
In this vibrant infographic, Edit Gyenge uses data from resourcetrade.earth to track the exponential growth in the global honey export industry from 2000 to 2020.
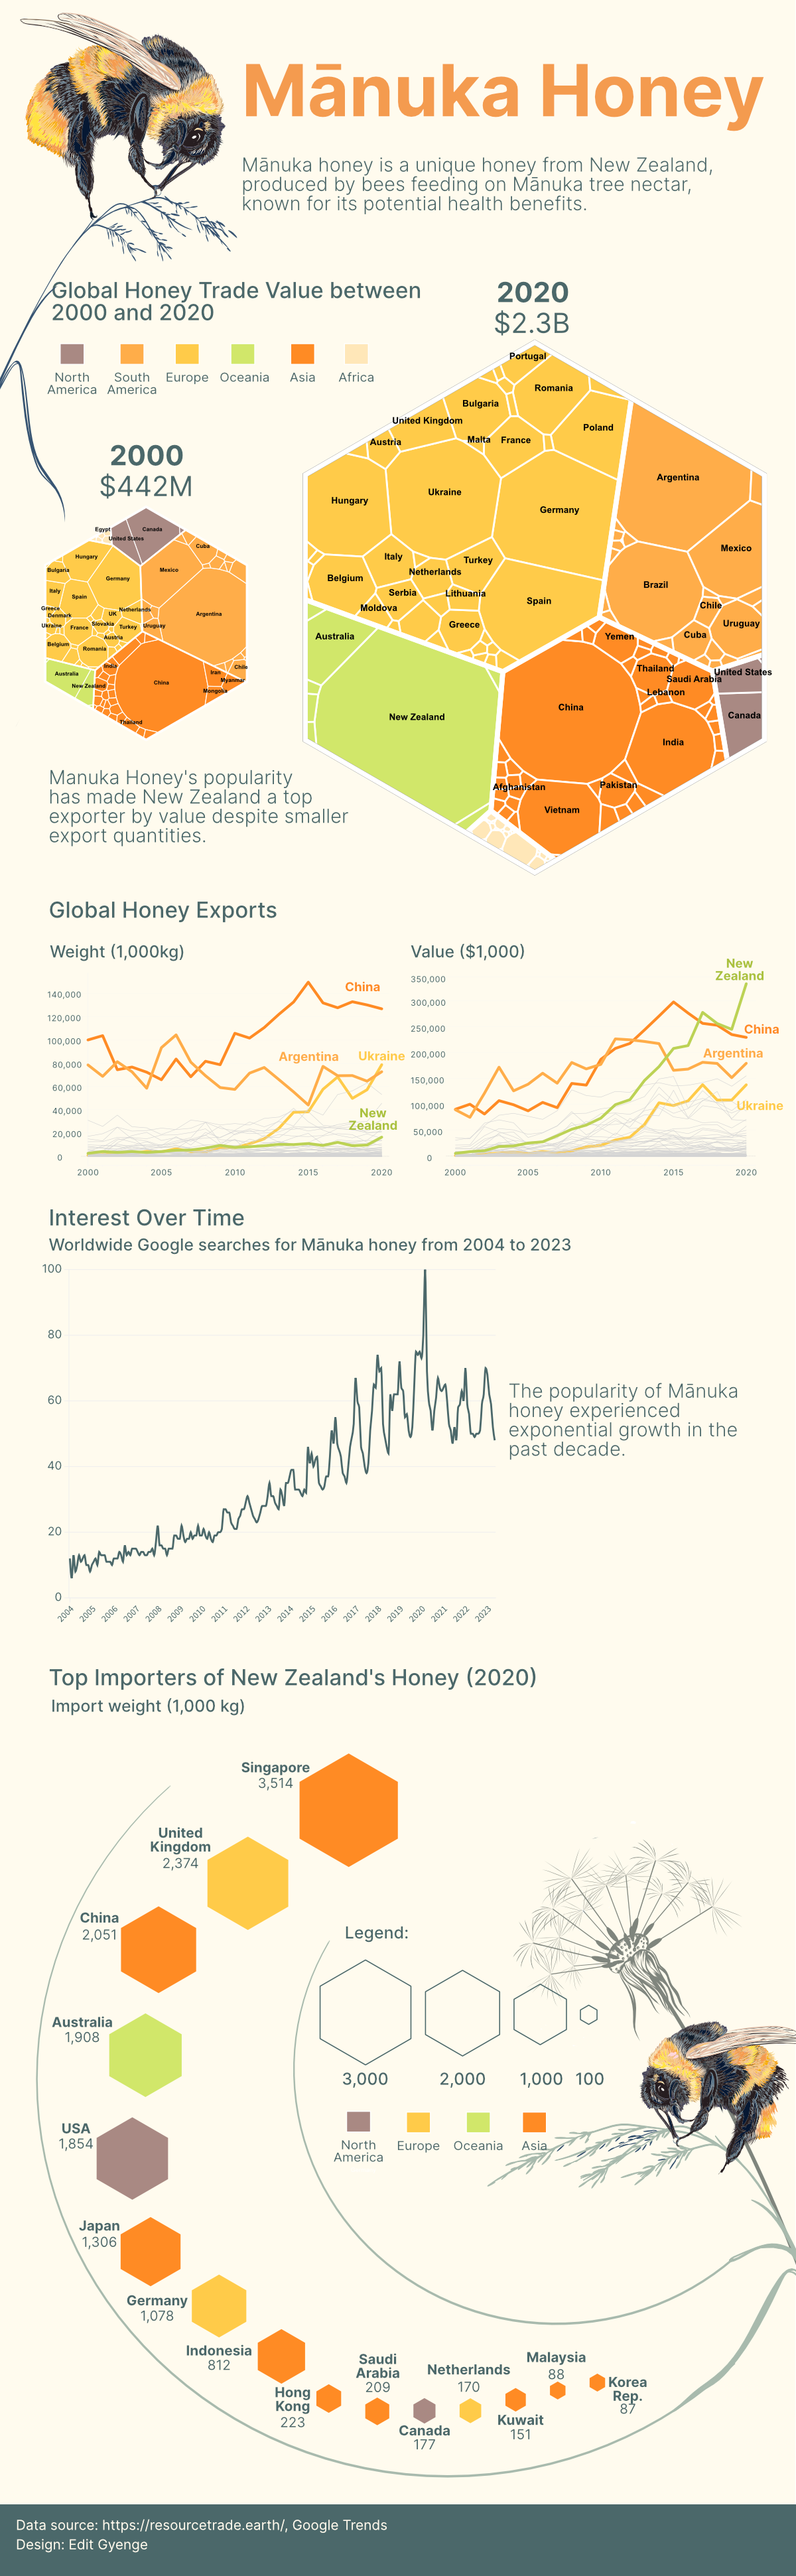
The Surge of Honey Money
Despite honey being harvested from beehives since antiquity, honey exports globally were only valued at $442 million in 2020. This number shot up to $2.3 billion in 2020.
| Rank | Honey Exporting Country | Value (2020 USD) |
Weight (2020 Tonnes) |
|---|---|---|---|
| 1 |  New Zealand New Zealand |
$333.34M | 16,547.36 |
| 2 |  China China |
$229.62M | 127,132.51 |
| 3 |  Argentina Argentina |
$179.58M | 72,920.54 |
| 4 |  Germany Germany |
$155.26M | 31,287.53 |
| 5 |  Ukraine Ukraine |
$137.99M | 78,983.95 |
| 6 |  Spain Spain |
$109.19M | 27,187.59 |
| 7 |  Brazil Brazil |
$100.27M | 45,733.41 |
| 8 |  Hungary Hungary |
$94.85M | 21,437.72 |
| 9 |  India India |
$87.56M | 53,288.02 |
| 10 |  Vietnam Vietnam |
$71.13M | 15,597.46 |
| 11 |  Mexico Mexico |
$68.72M | 21,101.57 |
| 12 |  Poland Poland |
$58.07M | 23,472.43 |
| 13 |  Romania Romania |
$49.99M | 13,925.81 |
| 14 |  Australia Australia |
$44.62M | 6,287.35 |
| 15 |  Belgium Belgium |
$40.48M | 10,709.40 |
| 16 |  Bulgaria Bulgaria |
$39.28M | 13,373.22 |
| 17 |  Canada Canada |
$35.09M | 9,112.48 |
| 18 |  Uruguay Uruguay |
$31.71M | 15,842.94 |
| 19 |  France France |
$29.83M | 4,342.84 |
| 20 |  United Kingdom United Kingdom |
$27.24M | 5,651.56 |
| 21 |  Turkey Turkey |
$25.53M | 5,695.40 |
| 22 |  Saudi Arabia Saudi Arabia |
$25.24M | 3,073.50 |
| 23 |  Italy Italy |
$23.67M | 3,743.44 |
| 24 |  United States United States |
$20.77M | 6,002.50 |
| 25 |  Greece Greece |
$20.09M | 4,256.29 |
| 26 |  Thailand Thailand |
$18.38M | 7,773.81 |
| 27 |  Yemen Yemen |
$17.11M | 1,167.04 |
| 28 |  Netherlands Netherlands |
$15.73M | 3,057.09 |
| 29 |  Cuba Cuba |
$15.67M | 7,452.37 |
| 30 |  Denmark Denmark |
$15.11M | 3,158.17 |
| 31 |  Serbia Serbia |
$15.10M | 2,693.89 |
| 32 |  Portugal Portugal |
$13.47M | 7,293.22 |
| 33 |  Pakistan Pakistan |
$12.44M | 4,975.70 |
| 34 |  Austria Austria |
$11.38M | 1,890.84 |
| 35 |  Moldova Moldova |
$8.99M | 3,416.76 |
| 36 |  Lithuania Lithuania |
$8.49M | 3,126.86 |
| 37 |  Egypt Egypt |
$7.78M | 1,675.96 |
| 38 |  Chile Chile |
$6.53M | 2,075.44 |
| 39 |  United Arab Emirates United Arab Emirates |
$5.76M | 2,371.64 |
| 40 |  Russian Federation Russian Federation |
$4.74M | 2,255.93 |
| 41 |  Ireland Ireland |
$4.62M | 758.02 |
| 42 |  Switzerland Switzerland |
$4.07M | 406.04 |
| 43 |  Myanmar Myanmar |
$3.98M | 3,160.46 |
| 44 |  Guatemala Guatemala |
$3.87M | 1,414.63 |
| 45 |  Slovakia Slovakia |
$3.58M | 921.78 |
| 46 |  Czech Republic Czech Republic |
$2.99M | 715.84 |
| 47 |  South Africa South Africa |
$2.87M | 753.00 |
| 48 |  Singapore Singapore |
$2.85M | 542.15 |
| 49 |  Zambia Zambia |
$2.79M | 951.16 |
| 50 |  El Salvador El Salvador |
$2.10M | 841.85 |
| 51 |  Kyrgyzstan Kyrgyzstan |
$1.95M | 451.50 |
| 52 |  Nicaragua Nicaragua |
$1.95M | 656.62 |
| 53 |  China, Hong Kong SAR China, Hong Kong SAR |
$1.93M | 484.14 |
| 54 |  Croatia Croatia |
$1.91M | 401.69 |
| 55 |  Slovenia Slovenia |
$1.77M | 293.55 |
| 56 |  Oman Oman |
$1.75M | 454.27 |
| 57 |  Sweden Sweden |
$1.44M | 227.90 |
| 58 |  Malaysia Malaysia |
$1.37M | 261.76 |
| 59 |  Japan Japan |
$1.16M | 118.28 |
| 60 |  Dominican Republic Dominican Republic |
$1.16M | 428.97 |
| 61 |  Bosnia Herzegovina Bosnia Herzegovina |
$1.08M | 87.38 |
| 62 |  Tanzania Tanzania |
$0.98M | 465.90 |
| 63 |  Latvia Latvia |
$0.97M | 256.66 |
| 64 |  Kuwait Kuwait |
$0.86M | 93.03 |
| 65 |  Norway Norway |
$0.86M | 175.08 |
| 66 |  Iran Iran |
$0.86M | 357.86 |
| 67 |  Lebanon Lebanon |
$0.85M | 111.91 |
| 68 |  Indonesia Indonesia |
$0.77M | 238.68 |
| 69 |  Ethiopia Ethiopia |
$0.73M | 178.98 |
| 70 |  Estonia Estonia |
$0.73M | 292.60 |
| 71 |  North Macedonia North Macedonia |
$0.64M | 132.12 |
| 72 |  Israel Israel |
$0.61M | 170.94 |
| 73 |  Kazakhstan Kazakhstan |
$0.52M | 195.46 |
| 74 |  Kenya Kenya |
$0.50M | 97.58 |
| 75 |  Belarus Belarus |
$0.46M | 104.69 |
| 76 |  Bangladesh Bangladesh |
$0.38M | 178.15 |
| 77 |  Madagascar Madagascar |
$0.35M | 80.65 |
| 78 |  Sri Lanka Sri Lanka |
$0.31M | 28.10 |
| 79 |  Sierra Leone Sierra Leone |
$0.29M | 96.19 |
| 80 |  State of Palestine State of Palestine |
$0.28M | 69.73 |
| 81 |  Jordan Jordan |
$0.27M | 44.21 |
| 82 |  Sudan Sudan |
$0.25M | 56.45 |
| 83 |  Georgia Georgia |
$0.25M | 65.61 |
| 84 |  Morocco Morocco |
$0.21M | 32.90 |
| 85 |  Luxembourg Luxembourg |
$0.19M | 26.71 |
| 86 |  Libya Libya |
$0.18M | 25.45 |
| 87 |  Armenia Armenia |
$0.14M | 20.79 |
| 88 |  Korea, Republic Korea, Republic |
$0.13M | 21.99 |
| 89 |  Finland Finland |
$0.12M | 13.29 |
| 90 |  Syria Syria |
$0.11M | 38.27 |
| 91 |  Suriname Suriname |
$0.10M | 37.96 |
| 92 |  Uzbekistan Uzbekistan |
$0.08M | 37.11 |
| 93 |  Antigua and Barbuda Antigua and Barbuda |
$0.07M | 27.77 |
| 94 |  Cyprus Cyprus |
$0.06M | 12.99 |
| 95 |  Benin Benin |
$0.06M | 49.29 |
| 96 |  Albania Albania |
$0.05M | 7.10 |
| 97 |  Brunei Darussalam Brunei Darussalam |
$0.05M | 19.22 |
| 98 |  Colombia Colombia |
$0.05M | 13.97 |
| 99 |  Qatar Qatar |
$0.05M | 7.62 |
| 100 |  Uganda Uganda |
$0.04M | 10.70 |
| 101 |  Samoa Samoa |
$0.03M | 19.46 |
| 102 |  Burkina Faso Burkina Faso |
$0.03M | 4.24 |
| 103 |  Jamaica Jamaica |
$0.03M | 3.91 |
| 104 |  Nepal Nepal |
$0.03M | 7.50 |
| 105 |  Mali Mali |
$0.03M | 75.58 |
| 106 |  Tajikistan Tajikistan |
$0.03M | 7.33 |
| 107 |  Philippines Philippines |
$0.03M | 4.27 |
| 108 |  Mauritius Mauritius |
$0.03M | 1.99 |
| 109 |  Botswana Botswana |
$0.02M | 3.86 |
| 110 |  Mozambique Mozambique |
$0.02M | 12.26 |
| 111 |  Eswatini Eswatini |
$0.02M | 2.29 |
| 112 |  Senegal Senegal |
$0.02M | 22.56 |
| 113 |  Peru Peru |
$0.02M | 2.80 |
| 114 |  Iceland Iceland |
$0.01M | 13.57 |
| 115 |  Ecuador Ecuador |
$0.01M | 1.22 |
| 116 |  Cameroon Cameroon |
$0.01M | 7.01 |
| 117 |  Bahrain Bahrain |
$0.01M | 0.34 |
| 118 |  Azerbaijan Azerbaijan |
$0.01M | 0.30 |
| 119 |  China, Macao SAR China, Macao SAR |
$0.01M | 0.81 |
| 120 |  Honduras Honduras |
$0.01M | 4.15 |
| 121 |  New Caledonia New Caledonia |
<$0.01M | 0.70 |
| 122 |  Ghana Ghana |
<$0.01M | 0.55 |
| 123 |  Afghanistan Afghanistan |
<$0.01M | 1.45 |
| 124 |  Nigeria Nigeria |
<$0.01M | 1.77 |
| 125 |  Guyana Guyana |
<$0.01M | 1.66 |
| 126 |  Malta Malta |
<$0.01M | 0.59 |
| 127 |  Guinea Guinea |
<$0.01M | 0.29 |
| 128 |  Pitcairn Pitcairn |
<$0.01M | 0.09 |
| 129 |  Cote d’Ivoire Cote d’Ivoire |
<$0.01M | 3.78 |
| 130 |  Cambodia Cambodia |
<$0.01M | 0.58 |
| 131 |  Trinidad and Tobago Trinidad and Tobago |
<$0.01M | 0.07 |
| 132 |  Cocos Islands Cocos Islands |
<$0.01M | 0.10 |
| 133 |  Saint Lucia Saint Lucia |
<$0.01M | 0.17 |
| 134 |  Rwanda Rwanda |
<$0.01M | 0.28 |
| 135 |  Grenada Grenada |
<$0.01M | 0.15 |
| 136 |  Burundi Burundi |
<$0.01M | 0.13 |
| 137 |  Mongolia Mongolia |
<$0.01M | 0.11 |
| 138 |  Andorra Andorra |
<$0.01M | 0.06 |
| 139 |  Bhutan Bhutan |
<$0.01M | 0.44 |
| 140 |  Aruba Aruba |
<$0.01M | 0.05 |
| 141 |  Tunisia Tunisia |
<$0.01M | 0.20 |
| 142 |  French Polynesia French Polynesia |
<$0.01M | 0.04 |
| 143 |  Montenegro Montenegro |
<$0.01M | 0.07 |
| 144 |  Lesotho Lesotho |
<$0.01M | 0.02 |
| 145 |  Algeria Algeria |
<$0.01M | 0.01 |
| 146 |  Bermuda Bermuda |
<$0.01M | 0.04 |
| 147 |  Djibouti Djibouti |
<$0.01M | 0.07 |
| 148 |  South Sudan South Sudan |
<$0.01M | 0.44 |
| 149 |  Panama Panama |
<$0.01M | 0.01 |
| 150 |  Equatorial Guinea Equatorial Guinea |
<$0.01M | 0.05 |
| 151 |  Costa Rica Costa Rica |
<$0.01M | 0.01 |
| 152 |  Fiji Fiji |
<$0.01M | 0.01 |
| 153 |  Chad Chad |
<$0.01M | 0.04 |
| 154 |  Timor-Leste Timor-Leste |
<$0.01M | 0.05 |
| 155 |  Papua New Guinea Papua New Guinea |
<$0.01M | 0.01 |
| 156 |  Somalia Somalia |
<$0.01M | 0.02 |
| 157 |  Lao PDR Lao PDR |
<$0.01M | 0.01 |
| 158 |  Congo, Republic Congo, Republic |
<$0.01M | 0.01 |
| 159 |  Malawi Malawi |
<$0.01M | 0.03 |
| 160 |  Congo, Democratic Republic Congo, Democratic Republic |
<$0.01M | 0.00 |
| 161 |  Iraq Iraq |
<$0.01M | 0.00 |
| 162 |  Paraguay Paraguay |
<$0.01M | 0.01 |
| 163 |  Central African Republic Central African Republic |
<$0.01M | 0.08 |
| 164 |  Gambia Gambia |
<$0.01M | 0.00 |
| 165 |  Namibia Namibia |
<$0.01M | 0.00 |
| 166 |  Togo Togo |
<$0.01M | 0.00 |
| 167 |  Maldives Maldives |
<$0.01M | 0.00 |
In the span between 2000 and 2020, agricultural powerhouses such as China, Argentina, and Ukraine consistently maintained their position as the top honey producers in the world. These nations exported thousands of tonnes of honey globally.
In fact, China continued to hold the position of the number one honey producer in pure volume terms in 2020.
However, New Zealand’s sought-after and expensive Mānuka honey put it far ahead of China and other countries in export value, despite not being anywhere near the largest exporter by volume.
What is Mānuka Honey?
Mānuka honey is produced by bees that collect nectar from Mānuka trees found only in New Zealand and some parts of Australia.
Known for its unique antibacterial and tissue regeneration properties, Mānuka honey has become highly coveted. In some countries it can sell for up to $400 per kilogram.
In 2020, New Zealand earned over $333 million through its honey exports. Most of this honey was imported by Asian nations including Singapore, China, Japan, Indonesia, and Hong Kong.
A Sticky Future for Honey Trade
The production of honey worldwide relies on the bees and the trees, both of which are under threat as the climate changes.
While floods devastated bee colonies in some parts of the world, bushfires and disease are affecting honeybee habitats in others, posing a major threat to the future of honey production.
The post Mānuka Honey: New Zealand’s Sweet Success in the Global Honey Trade appeared first on Visual Capitalist.


