


2025-04-17 06:18:00
nickjones.tech
There’s a gap in rugby data.
We’ve got the big moments covered — the tries, conversions, and cards. Structured event feeds do a good job of telling you what happened.
But they’re not so good at telling you why.
At Gainline, we build our entire app around context. We want to give rugby fans a second-screen experience that feels alive — a commentary that goes deeper than the scoreline. We already pull in weather data, team stats, and player profiles. We enrich it with AI-generated summaries.
But we’re limited by the data we get.
We don’t know why the ref blew the whistle. We can’t tell if a prop is quietly dominating the scrum. We miss what the ref said to the captain. And that’s a problem — because these moments matter when you’re trying to tell the full story of a match.
So we asked ourselves a simple question:
What if we could watch the game and generate the data ourselves?
That led me down a really fun rabbit hole.
In this post, I’ll show you how I built a prototype system that watches a rugby game using AI. We’ll look at how we extracted the score and game clock from the broadcaster’s UI, how we used Whisper to transcribe referee and commentary audio, and what we learned about running these kinds of experiments cheaply and effectively.
It’s scrappy — but it works.
Context is Everything
It’s a clean, well-designed experience that gives fans what they need. We pull together data from a range of providers — live scores, player stats, team histories — and try to tell a richer story about what’s happening on the pitch.
Most of it works well. If you want to know who scored the last try, who the fly-half is, or who’s made the most carries, we’ve got you covered.
But rugby is messy.
A lot happens between structured events. Penalties go unexplained. Players work relentlessly in ways that never show up in the stats. Props spend 80 minutes blowing their lungs out — maybe earning a mention if they score.
And we can’t see any of it.
That’s frustrating — because it limits our AI-generated summaries. If all we know is that a penalty occurred, we can’t say why. We can’t spot a breakdown nightmare or a dominant scrum.
The best rugby minds don’t just watch the ball — they read the whole game.
That’s what we want Gainline to do.
The Idea
What if we could watch the game ourselves?
Not literally. We can’t hire analysts to watch every match and enter data manually.
But AI? That just might work 😁
The plan was simple.
Take a video of a rugby game. Slice it into screenshots — one every five seconds. Feed those frames into OpenAI’s vision model and ask it what’s going on.
Can We Read the Score?
We started with a lazy approach: What can we detect easily? Let’s begin with the basics.
What’s the score? What does the game clock say?
But I was also curious — what can the model really see?
Here’s the prompt I used (built through a separate refinement process — another post for another day!):
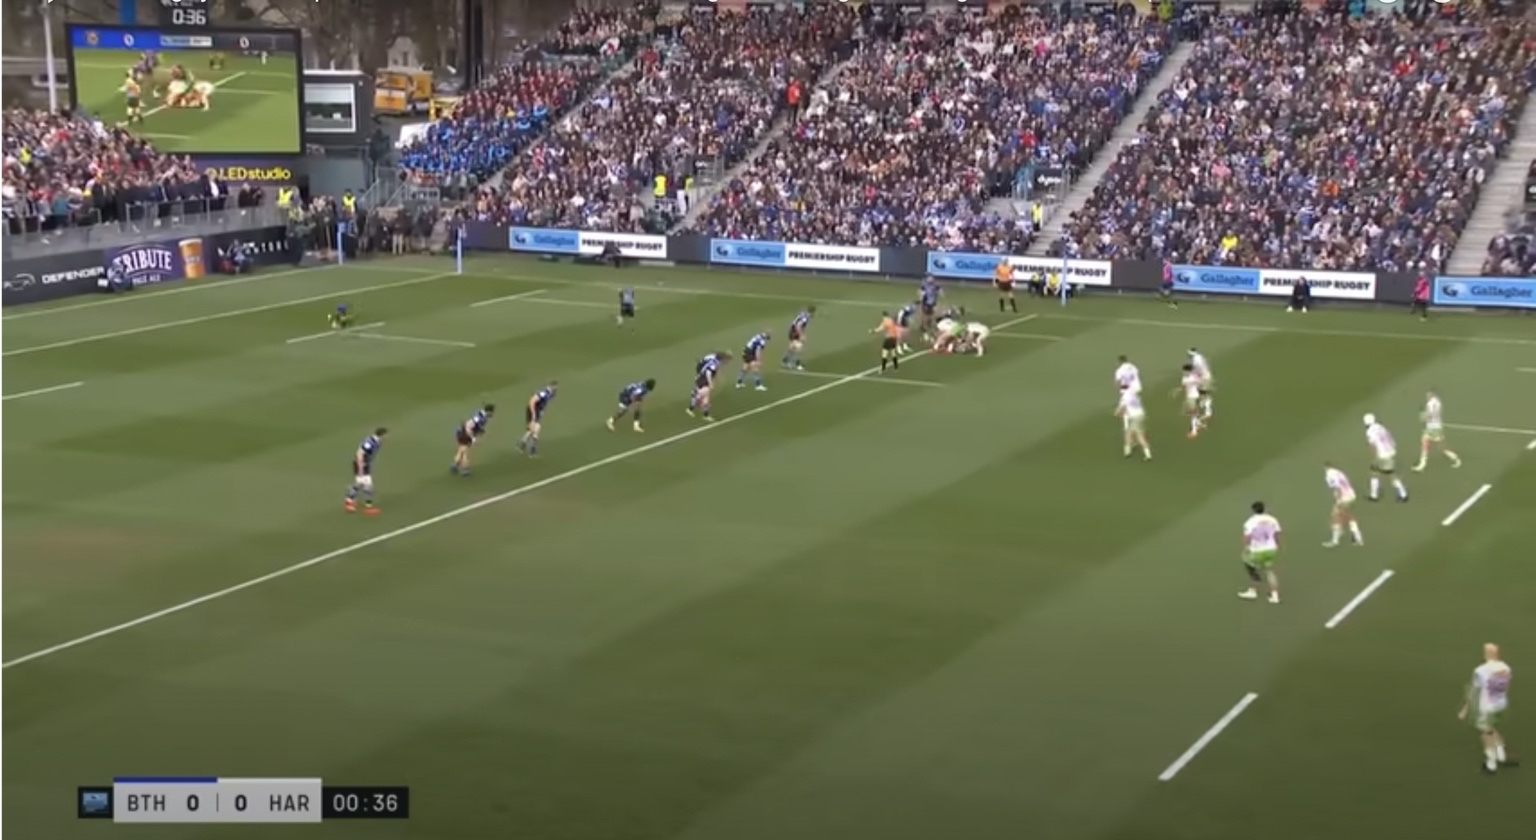
You are an AI that analyzes screenshots of rugby matches. Your task is to visually interpret the image and extract structured game information — including the score, time, team names, and match phase (e.g., first half, second half, full time). Return the data in a clear, structured format suitable for programmatic use (e.g., JSON). Focus on identifying all elements that summarize the current state of the match.
The result:
1
2
3
4
5
6
7
8
9
10
11
12
13
14
15
16


{
  "home_team": "Bath Rugby",
  "away_team": "Harlequins",
  "home_team_abbreviation": "BTH",
  "away_team_abbreviation": "HAR",
  "score": {
    "BTH": 0,
    "HAR": 0
  },
  "time_elapsed": "00:36",
  "match_phase": "first_half",
  "competition": "Gallagher Premiership",
  "current_play": "ruck",
  "bath_team_kit": "dark blue with light blue accents",
  "harlequins_team_kit": "white with green shorts and multicolor accents"
}
It worked. Remarkably well.
But vision models price their API calls based on context size — the number of tokens an image turns into. Sending a full-resolution screenshot every five seconds gets expensive fast.
So the next challenge became: how do we do this cheaper?
Reducing Context Size
Let’s zoom in on the essentials. What if we only want the score and elapsed time?
If we crop the image down to just the scoreboard, we can dramatically reduce the size — and cost.
I first asked the model to return the pixel coordinates of the scoreboard.
It didn’t work.
I couldn’t get a reliable bounding box.
I’m not exactly sure why. I tried several approaches. I thought maybe the image was being resized internally, so I switched to asking for percentages instead of pixel values — but the results were still off.
Then I realised: I didn’t need a bounding box.
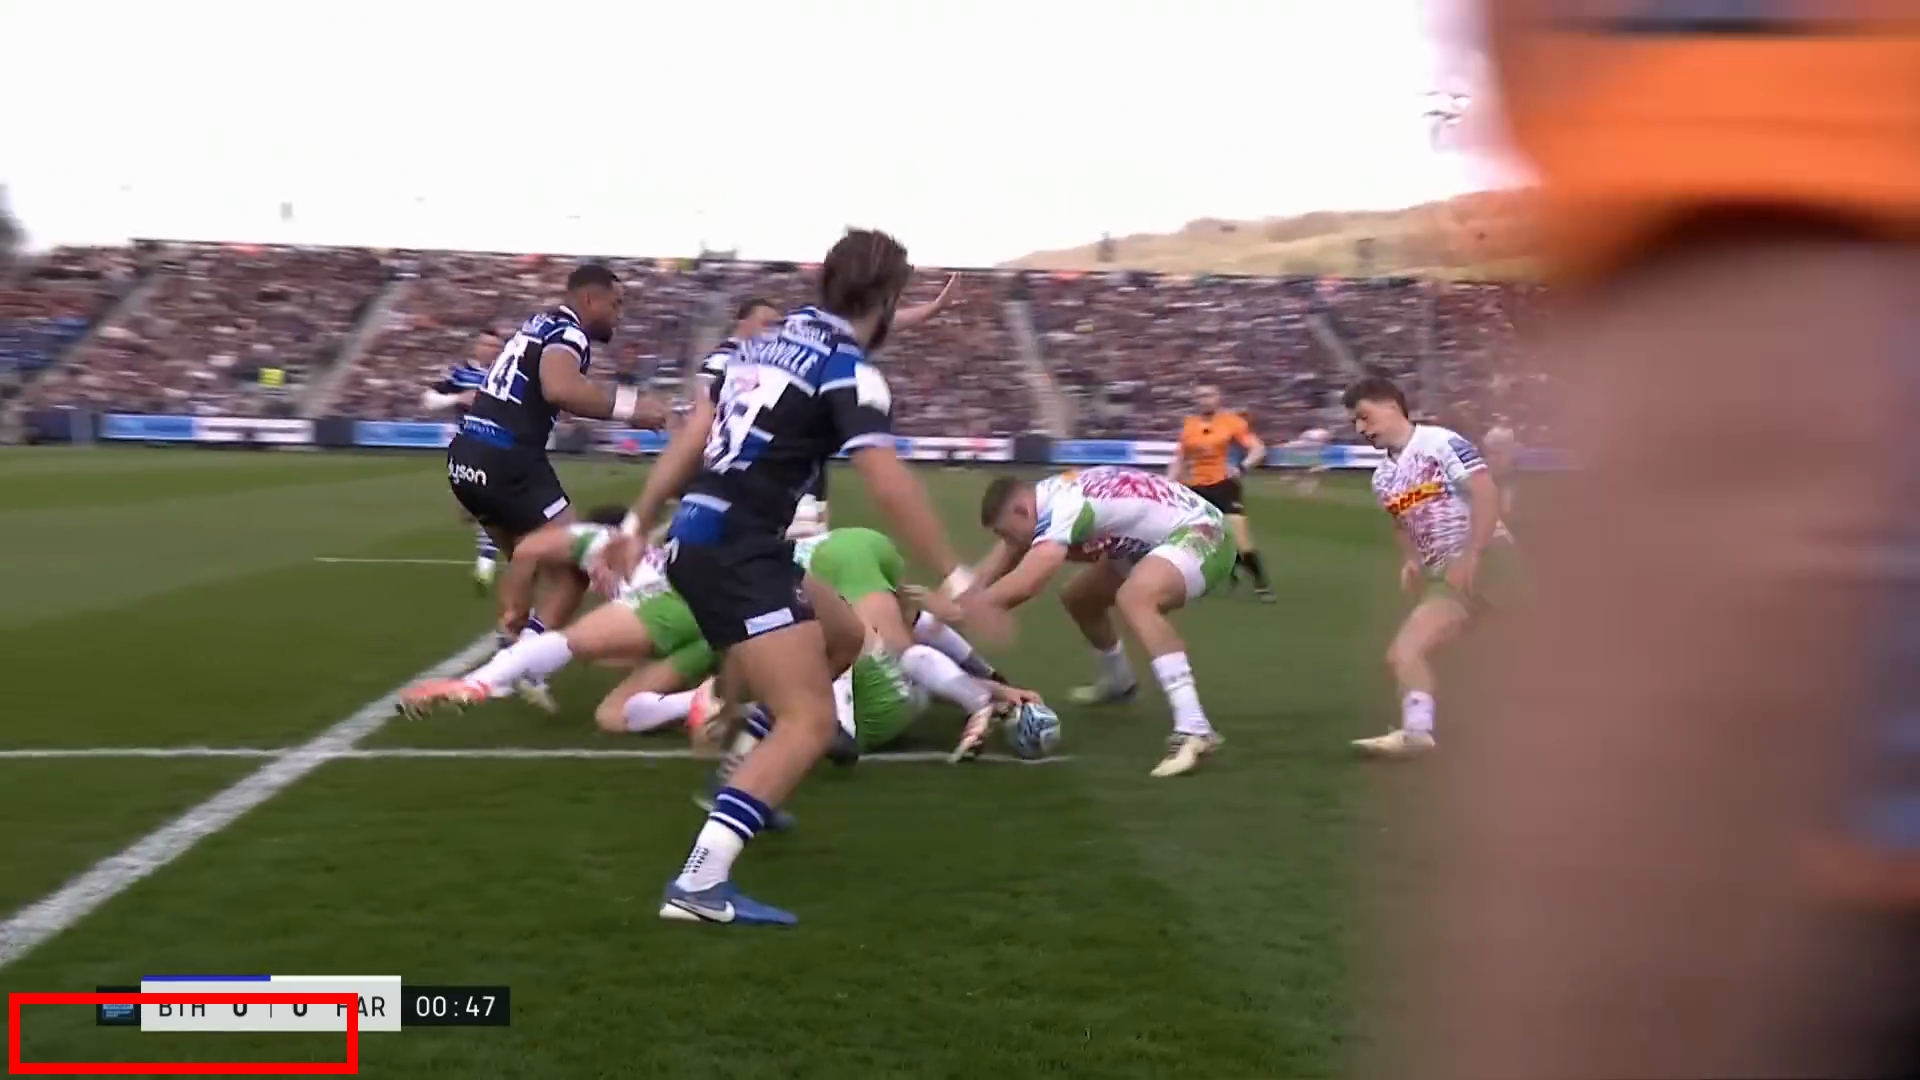
The scoreboard always appears in one of the corners. Cropping to that corner gave me a 75% reduction in image size.
I updated the prompt. It worked perfectly. Cheap, reliable, and didn’t require complex image processing.
Isn’t It Just a Diff?
Do we really need a language model to find the scoreboard?
Broadcasts usually place the scoreboard in a consistent location — often the top-left or top-right. Could we just diff two frames — one with the scoreboard, one without — to detect the UI?
In theory, yes.
The static background would cancel out, leaving only the overlay.

Here’s the command:
1
2


magick compare -highlight-color Red -lowlight-color Black \
  -compose src frame_000015.png frame_000016.png diff.png
It’s rough, but you can see it working. We clearly identify a corner. We can crop it or add padding and target only the pixels that change.
This whole project is about finding the simplest, most reliable way to generate rugby data.
And if that means using less AI — even better.
Do We Need an LLM at All?
We started with large language models because they were the easiest tool to prototype with. I could send an image to OpenAI’s vision model, describe what I wanted, and get useful results.
But I started wondering — do we even need an LLM here?
We’re just trying to extract text from a predictable area — the scoreboard.
So I tried tesseract, an open-source OCR tool, to get the score and clock.
It kind of worked. But not well enough.
The problem was quality. Blurry frames, low resolution, and complex overlays made OCR tricky. When it worked, it worked well. But when it failed, it didn’t extract anything useful.
Maybe it would do better with higher-quality streams or some pre-processing — but in my test setup, it wasn’t reliable.
So for now — the LLM stays.
Bonus: Listening to the Game
Once I had the score and clock, I turned to the audio.
Rugby broadcasts are full of context:
- The referee mic explains decisions.
- The commentary adds subjective analysis.
- The crowd adds atmosphere.
I used OpenAI Whisper to transcribe the audio. It worked brilliantly — giving me timestamped commentary I could use to enrich the structured data.
Now I could highlight a prop’s incredible shift, or capture events that don’t show up in a stat feed — like missed penalties, scuffles, or Freddie Burns celebrating too early.
I can’t wait to integrate this properly.
Instead of just showing the facts — we can start telling the story.
What’s Next?
This is a prototype. It’s not production ready. But it shows what’s possible.
Scaling this will be an infrastructure challenge:
- Should we spin up VMs to watch live streams?
- Do we run distributed workers that pull frames and audio?
- How do we handle different broadcasters, formats, and languages?
Then there are the legal and ethical questions.
We’re not trying to replace broadcasters or journalists. But if AI can watch a game and summarise it in real-time — is that just automated journalism?
It’s a question we’ll have to answer.
This has been one of the most fun experiments I’ve worked on in a while.
AI is moving beyond structured data and customer support chatbots. These models are growing exponentially more capable. As a developer, it’s my job to stay close to that evolution — to know what’s possible, what’s not, and where the limits lie.
For rugby — and for sport more broadly — I think the opportunity is huge.
We can do more with less. Unlock better insights. Tell richer stories. And have way more fun.

Keep your files stored safely and securely with the SanDisk 2TB Extreme Portable SSD. With over 69,505 ratings and an impressive 4.6 out of 5 stars, this product has been purchased over 8K+ times in the past month. At only $129.99, this Amazon’s Choice product is a must-have for secure file storage.
Help keep private content private with the included password protection featuring 256-bit AES hardware encryption. Order now for just $129.99 on Amazon!
Help Power Techcratic’s Future – Scan To Support
If Techcratic’s content and insights have helped you, consider giving back by supporting the platform with crypto. Every contribution makes a difference, whether it’s for high-quality content, server maintenance, or future updates. Techcratic is constantly evolving, and your support helps drive that progress.
As a solo operator who wears all the hats, creating content, managing the tech, and running the site, your support allows me to stay focused on delivering valuable resources. Your support keeps everything running smoothly and enables me to continue creating the content you love. I’m deeply grateful for your support, it truly means the world to me! Thank you!
|
BITCOIN
bc1qlszw7elx2qahjwvaryh0tkgg8y68enw30gpvge Scan the QR code with your crypto wallet app |
|
DOGECOIN
D64GwvvYQxFXYyan3oQCrmWfidf6T3JpBA Scan the QR code with your crypto wallet app |
|
ETHEREUM
0xe9BC980DF3d985730dA827996B43E4A62CCBAA7a Scan the QR code with your crypto wallet app |


Please read the Privacy and Security Disclaimer on how Techcratic handles your support.
Disclaimer: As an Amazon Associate, Techcratic may earn from qualifying purchases.


