


2025-06-15 15:55:00
pypy.org
While working on a paper about allocation profiling in
VMProf I got curious
about how quickly the RPython GC can allocate an object. I wrote a small
RPython benchmark program to get an idea of the order of magnitude.
The basic idea is to just allocate an instance in a tight loop:
class A(object):
    pass

def run(loops):
    # preliminary idea, see below
    for i in range(loops):
        a = A()
        a.i = i
The RPython type inference will find out that instances of A have a single
i field, which is an integer. In addition to that field, every RPython object
needs one word of GC meta-information. Therefore one instance of A needs 16
bytes on a 64-bit architecture.
However, measuring like this is not good enough, because the RPython static
optimizer would remove the allocation since the object isn’t used. But we can
confuse the escape analysis sufficiently by always keeping two instances alive
at the same time:
class A(object):
    pass

def run(loops):
    a = prev = None
    for i in range(loops):
        prev = a
        a = A()
        a.i = i
    print(prev, a) # print the instances at the end
(I confirmed that the allocation isn’t being removed by looking at the C code
that the RPython compiler generates from this.)
This is doing a little bit more work than needed, because of the a.i = i
instance attribute write. We can also (optionally) leave the field
uninitialized.
def run(initialize_field, loops):
    t1 = time.time()
    if initialize_field:
        a = prev = None
        for i in range(loops):
            prev = a
            a = A()
            a.i = i
        print(prev, a) # make sure always two objects are alive
    else:
        a = prev = None
        for i in range(loops):
            prev = a
            a = A()
        print(prev, a)
    t2 = time.time()
    print(t2 - t1, 's')
    object_size_in_words = 2 # GC header, one integer field
    mem = loops * 8 * object_size_in_words / 1024.0 / 1024.0 / 1024.0
    print(mem, 'GB')
    print(mem / (t2 - t1), 'GB/s')
Then we need to add some RPython scaffolding:
def main(argv):
    loops = int(argv[1])
    with_init = bool(int(argv[2]))
    if with_init:
        print("with initialization")
    else:
        print("without initialization")
    run(with_init, loops)
    return 0

def target(*args):
    return main
To build a binary:
pypy rpython/bin/rpython targetallocatealot.py
Which will turn the RPython code into C code and use a C compiler to turn that
into a binary, containing both our code above as well as the RPython garbage
collector.
Then we can run it (all results again from my AMD Ryzen 7 PRO 7840U, running
Ubuntu Linux 24.04.2):
$ ./targetallocatealot-c 1000000000 0
without initialization

0.433825 s
14.901161 GB
34.348322 GB/s
$ ./targetallocatealot-c 1000000000 1
with initialization

0.501856 s
14.901161 GB
29.692100 GB/s
Let’s compare it with the Boehm GC:
$ pypy rpython/bin/rpython --gc=boehm --output=targetallocatealot-c-boehm targetallocatealot.py
...
$ ./targetallocatealot-c-boehm 1000000000 0
without initialization

9.722585 s
14.901161 GB
1.532634 GB/s
$ ./targetallocatealot-c-boehm 1000000000 1
with initialization

9.684149 s
14.901161 GB
1.538717 GB/s
This is not a fair comparison, because the Boehm GC uses conservative stack
scanning, therefore it cannot move objects, which requires much more
complicated allocation.
Let’s look at perf stats
We can use perf to get some statistics about the executions:
$ perf stat -e cache-references,cache-misses,cycles,instructions,branches,faults,migrations ./targetallocatealot-c 10000000000 0
without initialization

4.301442 s
149.011612 GB
34.642245 GB/s

 Performance counter stats for './targetallocatealot-c 10000000000 0':

     7,244,117,828      cache-references
        23,446,661      cache-misses                     #    0.32% of all cache refs
    21,074,240,395      cycles
   110,116,790,943      instructions                     #    5.23  insn per cycle
    20,024,347,488      branches
             1,287      faults
                24      migrations

       4.303071693 seconds time elapsed

       4.297557000 seconds user
       0.003998000 seconds sys

$ perf stat -e cache-references,cache-misses,cycles,instructions,branches,faults,migrations ./targetallocatealot-c 10000000000 1
with initialization

5.016772 s
149.011612 GB
29.702688 GB/s

 Performance counter stats for './targetallocatealot-c 10000000000 1':

     7,571,461,470      cache-references
       241,915,266      cache-misses                     #    3.20% of all cache refs
    24,503,497,532      cycles
   130,126,387,460      instructions                     #    5.31  insn per cycle
    20,026,280,693      branches
             1,285      faults
                21      migrations

       5.019444749 seconds time elapsed

       5.012924000 seconds user
       0.005999000 seconds sys
This is pretty cool, we can run this loop with >5 instructions per cycle. Every
allocation takes 110116790943 / 10000000000 ≈ 11 instructions and
21074240395 / 10000000000 ≈ 2.1 cycles, including the loop around it.
How often does the GC run?
The RPython GC queries the L2 cache size to determine the size of the nursery.
We can find out what it is by turning on PYPYLOG, selecting the proper logging
categories, and printing to stdout via :-:
$ PYPYLOG=gc-set-nursery-size,gc-hardware:- ./targetallocatealot-c 1 1
[f3e6970465723] {gc-set-nursery-size
nursery size: 270336
[f3e69704758f3] gc-set-nursery-size}
[f3e697047b9a1] {gc-hardware
L2cache = 1048576
[f3e69705ced19] gc-hardware}
[f3e69705d11b5] {gc-hardware
memtotal = 32274210816.000000
[f3e69705f4948] gc-hardware}
[f3e6970615f78] {gc-set-nursery-size
nursery size: 4194304
[f3e697061ecc0] gc-set-nursery-size}
with initialization
NULL
0.000008 s
0.000000 GB
0.001894 GB/s
So the nursery is 4 MiB. This means that when we allocate 14.9 GiB the GC needs to perform 10000000000 * 16 / 4194304 ≈ 38146 minor collections. Let’s confirm that:
$ PYPYLOG=gc-minor:out ./targetallocatealot-c 10000000000 1
with initialization
w
5.315511 s
149.011612 GB
28.033356 GB/s
$ head out
[f3ee482f4cd97] {gc-minor
[f3ee482f53874] {gc-minor-walkroots
[f3ee482f54117] gc-minor-walkroots}
minor collect, total memory used: 0
number of pinned objects: 0
total size of surviving objects: 0
time taken: 0.000029
[f3ee482f67b7e] gc-minor}
[f3ee4838097c5] {gc-minor
[f3ee48380c945] {gc-minor-walkroots
$ grep "{gc-minor-walkroots" out | wc -l
38147
Each minor collection is very quick, because a minor collection is
O(surviving objects), and in this program only one object survive each time
(the other instance is in the process of being allocated).
Also, the GC root shadow stack is only one entry, so walking that is super
quick as well. The time the minor collections take is logged to the out file:
$ grep "time taken" out | tail
time taken: 0.000002
time taken: 0.000002
time taken: 0.000002
time taken: 0.000002
time taken: 0.000002
time taken: 0.000002
time taken: 0.000002
time taken: 0.000003
time taken: 0.000002
time taken: 0.000002
$ grep "time taken" out | grep -o "0.*" | numsum
0.0988160000000011
(This number is super approximate due to float formatting rounding.)
that means that 0.0988160000000011 / 5.315511 ≈ 2% of the time is spent in the GC.
What does the generated machine code look like?
The allocation fast path of the RPython GC is a simple bump pointer, in Python
pseudo-code it would look roughly like this:
result = gc.nursery_free
# Move nursery_free pointer forward by totalsize
gc.nursery_free = result + totalsize
# Check if this allocation would exceed the nursery
if gc.nursery_free > gc.nursery_top:
    # If it does => collect the nursery and al
    result = collect_and_reserve(totalsize)
result.hdr = GC flags and type id of A>
So we can disassemble the compiled binary targetallocatealot-c and try to
find the equivalent logic in machine code. I’m super bad at reading machine
code, but I tried to annotate what I think is the core loop (the version
without initializing the i field) below:
    ...
    cb68:   mov    %rbx,%rdi
    cb6b:   mov    %rdx,%rbx

    # initialize object header of object allocated in previous iteration
    cb6e:   movq   $0x4c8,(%rbx)

    # loop termination check
    cb75:   cmp    %rbp,%r12
    cb78:   je     ccb8

    # load nursery_free
    cb7e:   mov    0x33c13(%rip),%rdx

    # increment loop counter
    cb85:   add    $0x1,%rbp

    # add 16 (size of object) to nursery_free
    cb89:   lea    0x10(%rdx),%rax

    # compare nursery_top with new nursery_free
    cb8d:   cmp    %rax,0x33c24(%rip)

    # store new nursery_free
    cb94:   mov    %rax,0x33bfd(%rip)

    # if new nursery_free exceeds nursery_top, fall through to slow path, if not, start at top
    cb9b:   jae    cb68

    # slow path from here on:
    # save live object from last iteration to GC shadow stack
    cb9d:   mov    %rbx,-0x8(%rcx)
    cba1:   mov    %r13,%rdi
    cba4:   mov    $0x10,%esi
    # do minor collection
    cba9:   call   20800 pypy_g_IncrementalMiniMarkGC_collect_and_reserve>
    ...
Running the benchmark as regular Python code
So far we ran this code as RPython, i.e. type inference is performed and the
program is translated to a C binary. We can also run it on top of PyPy, as a
regular Python3 program. However, an instance of a user-defined class in regular
Python when run on PyPy is actually a much larger object, due to dynamic
typing.
It’s at least 7 words, which is 56 bytes.
However, we can simply use int objects instead. Integers are allocated on the
heap and consist of two words, one for the GC and one with the
machine-word-sized integer value, if the integer fits into a signed 64-bit
representation (otherwise a less compact different representation is used,
which can represent arbitrarily large integers).
Therefore, we can simply use this kind of code:
import sys, time


def run(loops):
    t1 = time.time()
    a = prev = None
    for i in range(loops):
        prev = a
        a = i
    print(prev, a) # make sure always two objects are alive
    t2 = time.time()
    object_size_in_words = 2 # GC header, one integer field
    mem = loops * 28 / 1024.0 / 1024.0 / 1024.0
    print(mem, 'GB')
    print(mem / (t2 - t1), 'GB/s')

def main(argv):
    loops = int(argv[1])
    run(loops)
    return 0

if __name__ == '__main__':
    sys.exit(main(sys.argv))
In this case we can’t really leave the value uninitialized though.
We can run this both with and without the JIT:
$ pypy3 allocatealot.py 1000000000
999999998 999999999
14.901161193847656 GB
17.857494904899553 GB/s
$ pypy3 --jit off allocatealot.py 1000000000
999999998 999999999
14.901161193847656 GB
0.8275382375297171 GB/s
This is obviously much less efficient than the C code, the PyPy JIT generates
much less efficient machine code than GCC. Still, “only” twice as slow is kind
of cool anyway.
(Running it with CPython doesn’t really make sense for this measurements, since
CPython ints are bigger – sys.getsizeof(5) reports 28 bytes.)
The machine code that the JIT generates
Unfortunately it’s a bit of a journey to show the machine code that PyPy’s JIT generates for this. First we need to run with all jit logging categories:
$ PYPYLOG=jit:out pypy3 allocatealot.py 1000000000
Then we can read the log file to find the trace IR for the loop under the logging category jit-log-opt:
+532: label(p0, p1, p6, p9, p11, i34, p13, p19, p21, p23, p25, p29, p31, i44, i35, descr=TargetToken(137358545605472))
debug_merge_point(0, 0, 'run;/home/cfbolz/projects/gitpypy/allocatealot.py:6-9~#24 FOR_ITER')

# are we at the end of the loop
+552: i45 = int_lt(i44, i35)
+555: guard_true(i45, descr=Guard0x7ced4756a160>) [p0, p6, p9, p11, p13, p19, p21, p23, p25, p29, p31, p1, i44, i35, i34]
+561: i47 = int_add(i44, 1)
debug_merge_point(0, 0, 'run;/home/cfbolz/projects/gitpypy/allocatealot.py:6-9~#26 STORE_FAST')
debug_merge_point(0, 0, 'run;/home/cfbolz/projects/gitpypy/allocatealot.py:6-10~#28 LOAD_FAST')
debug_merge_point(0, 0, 'run;/home/cfbolz/projects/gitpypy/allocatealot.py:6-10~#30 STORE_FAST')
debug_merge_point(0, 0, 'run;/home/cfbolz/projects/gitpypy/allocatealot.py:6-11~#32 LOAD_FAST')
debug_merge_point(0, 0, 'run;/home/cfbolz/projects/gitpypy/allocatealot.py:6-11~#34 STORE_FAST')
debug_merge_point(0, 0, 'run;/home/cfbolz/projects/gitpypy/allocatealot.py:6-11~#36 JUMP_ABSOLUTE')

# update iterator object
+565: setfield_gc(p25, i47, descr=FieldS pypy.module.__builtin__.functional.W_IntRangeIterator.inst_current 8>)
+569: guard_not_invalidated(descr=Guard0x7ced4756a1b0>) [p0, p6, p9, p11, p19, p21, p23, p25, p29, p31, p1, i44, i34]

# check for signals
+569: i49 = getfield_raw_i(137358624889824, descr=FieldS pypysig_long_struct_inner.c_value 0>)
+582: i51 = int_lt(i49, 0)
+586: guard_false(i51, descr=Guard0x7ced4754db78>) [p0, p6, p9, p11, p19, p21, p23, p25, p29, p31, p1, i44, i34]
debug_merge_point(0, 0, 'run;/home/cfbolz/projects/gitpypy/allocatealot.py:6-9~#24 FOR_ITER')

# allocate the integer (allocation sunk to the end of the trace)
+592: p52 = new_with_vtable(descr=SizeDescr 16>)
+630: setfield_gc(p52, i34, descr=FieldS pypy.objspace.std.intobject.W_IntObject.inst_intval 8 pure>)
+634: jump(p0, p1, p6, p9, p11, i44, p52, p19, p21, p23, p25, p29, p31, i47, i35, descr=TargetToken(137358545605472))
To find the machine code address of the trace, we need to search for this line:
Loop 1 (run;/home/cfbolz/projects/gitpypy/allocatealot.py:6-9~#24 FOR_ITER) \
    has address 0x7ced473ffa0b to 0x7ced473ffbb0 (bootstrap 0x7ced473ff980)
Then we can use a script in the PyPy repo to disassemble the generated machine code:
$ pypy rpython/jit/backend/tool/viewcode.py out
This will dump all the machine code to stdout, and open a pygame-based
graphviz cfg. In there
we can search for the address and see this:
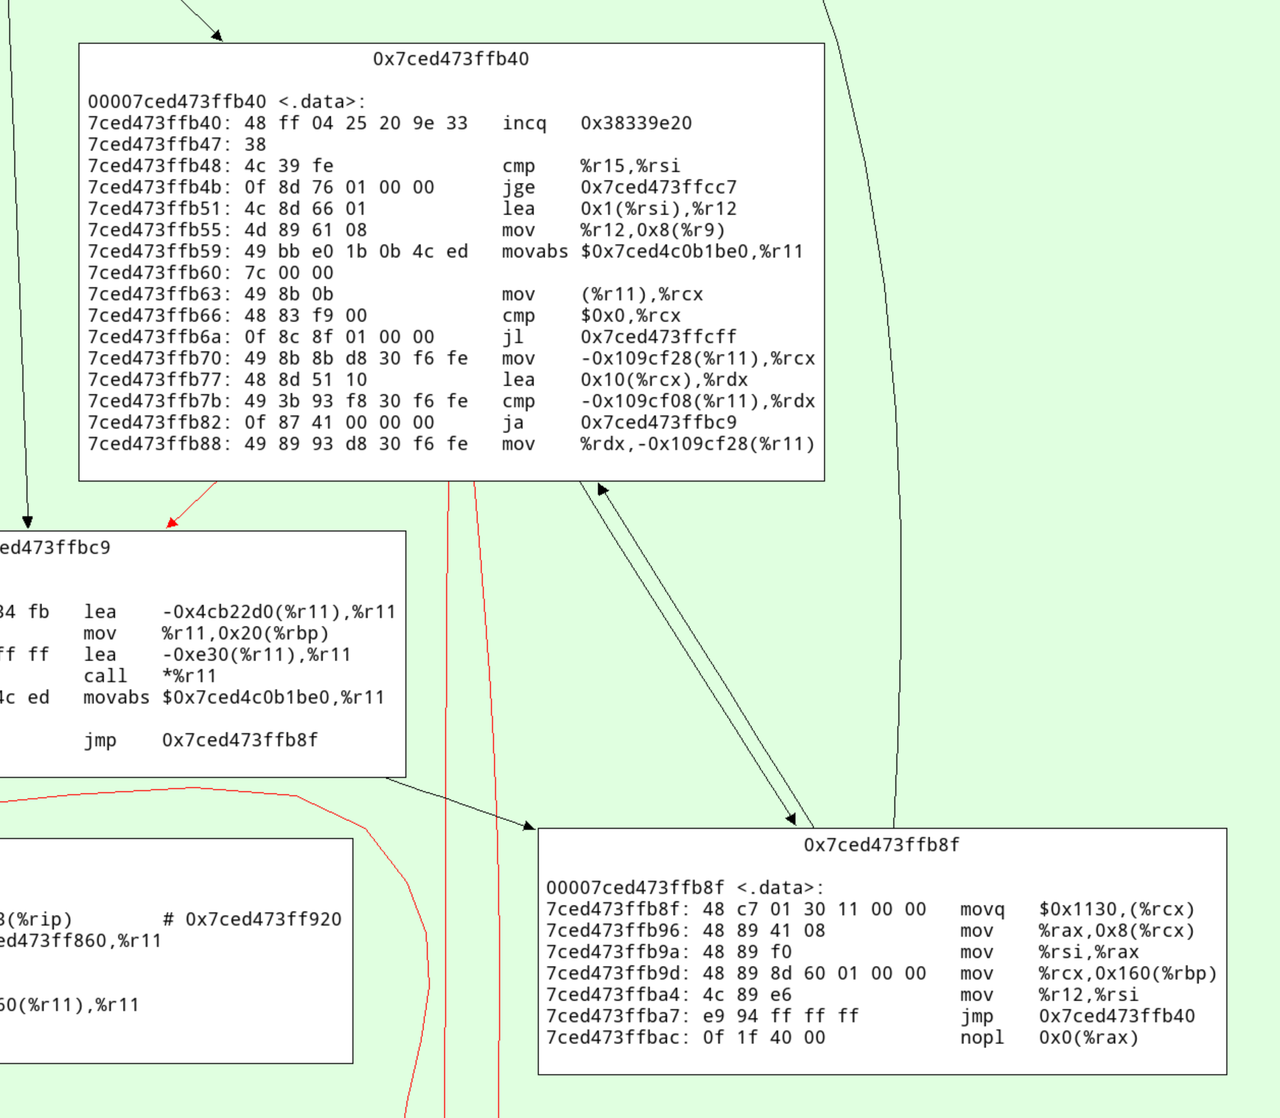
Here’s an annotated version with what I think this code does:
# increment the profile counter
7ced473ffb40:   48 ff 04 25 20 9e 33    incq   0x38339e20
7ced473ffb47:   38

# check whether the loop is done
7ced473ffb48:   4c 39 fe                cmp    %r15,%rsi
7ced473ffb4b:   0f 8d 76 01 00 00       jge    0x7ced473ffcc7

# increment iteration variable
7ced473ffb51:   4c 8d 66 01             lea    0x1(%rsi),%r12

# update iterator object
7ced473ffb55:   4d 89 61 08             mov    %r12,0x8(%r9)

# check for ctrl-c/thread switch
7ced473ffb59:   49 bb e0 1b 0b 4c ed    movabs $0x7ced4c0b1be0,%r11
7ced473ffb60:   7c 00 00
7ced473ffb63:   49 8b 0b                mov    (%r11),%rcx
7ced473ffb66:   48 83 f9 00             cmp    $0x0,%rcx
7ced473ffb6a:   0f 8c 8f 01 00 00       jl     0x7ced473ffcff

# load nursery_free pointer
7ced473ffb70:   49 8b 8b d8 30 f6 fe    mov    -0x109cf28(%r11),%rcx

# add size (16)
7ced473ffb77:   48 8d 51 10             lea    0x10(%rcx),%rdx

# compare against nursery top
7ced473ffb7b:   49 3b 93 f8 30 f6 fe    cmp    -0x109cf08(%r11),%rdx

# jump to slow path if nursery is full
7ced473ffb82:   0f 87 41 00 00 00       ja     0x7ced473ffbc9

# store new value of nursery free
7ced473ffb88:   49 89 93 d8 30 f6 fe    mov    %rdx,-0x109cf28(%r11)

# initialize GC header
7ced473ffb8f:   48 c7 01 30 11 00 00    movq   $0x1130,(%rcx)

# initialize integer field
7ced473ffb96:   48 89 41 08             mov    %rax,0x8(%rcx)
7ced473ffb9a:   48 89 f0                mov    %rsi,%rax
7ced473ffb9d:   48 89 8d 60 01 00 00    mov    %rcx,0x160(%rbp)
7ced473ffba4:   4c 89 e6                mov    %r12,%rsi
7ced473ffba7:   e9 94 ff ff ff          jmp    0x7ced473ffb40
7ced473ffbac:   0f 1f 40 00             nopl   0x0(%rax)
Conclusion
The careful design of the RPython GC’s allocation fast path gives pretty good
allocation rates. This technique isn’t really new, it’s a pretty typical way to
design a GC. Apart from that, my main conclusion would be that computers are
fast or something? Indeed, when we ran the same code on my colleague’s
two-year-old AMD, we got quite a bit worse results, so a lot of the speed seems
to be due to the hard work of CPU architects.

Keep your files stored safely and securely with the SanDisk 2TB Extreme Portable SSD. With over 69,505 ratings and an impressive 4.6 out of 5 stars, this product has been purchased over 8K+ times in the past month. At only $129.99, this Amazon’s Choice product is a must-have for secure file storage.
Help keep private content private with the included password protection featuring 256-bit AES hardware encryption. Order now for just $129.99 on Amazon!
Help Power Techcratic’s Future – Scan To Support
If Techcratic’s content and insights have helped you, consider giving back by supporting the platform with crypto. Every contribution makes a difference, whether it’s for high-quality content, server maintenance, or future updates. Techcratic is constantly evolving, and your support helps drive that progress.
As a solo operator who wears all the hats, creating content, managing the tech, and running the site, your support allows me to stay focused on delivering valuable resources. Your support keeps everything running smoothly and enables me to continue creating the content you love. I’m deeply grateful for your support, it truly means the world to me! Thank you!
|
BITCOIN
bc1qlszw7elx2qahjwvaryh0tkgg8y68enw30gpvge Scan the QR code with your crypto wallet app |
|
DOGECOIN
D64GwvvYQxFXYyan3oQCrmWfidf6T3JpBA Scan the QR code with your crypto wallet app |
|
ETHEREUM
0xe9BC980DF3d985730dA827996B43E4A62CCBAA7a Scan the QR code with your crypto wallet app |


Please read the Privacy and Security Disclaimer on how Techcratic handles your support.
Disclaimer: As an Amazon Associate, Techcratic may earn from qualifying purchases.


